
Why cap rate fails for short-term rentals
Cap rate works for long-term rentals where the rent is fixed, but it's a blunt tool for short-term rentals. Airbnb income swings wildly based on the season, local events, and day-of-the-week pricing. You're managing a hospitality business, not just a lease, so the math needs to account for higher turnover and variable costs.
I look at Net Operating Income (NOI), Cash Flow, and Cash-on-Cash Return to get the full picture. These numbers track the specific pain points of short-term stays, like the spike in utility bills when guests blast the AC and the constant cycle of cleaning fees.
Financing and property management play a huge role, too. High mortgage payments can eat into cash flow, and professional property management, while convenient, adds another expense. A dedicated rental property ROI calculator allows for a thorough examination of all these factors, giving you a far clearer picture than a simple cap rate ever could. It’s about understanding the true profitability, not just a surface-level estimate.
The goal isn’t just to buy a property; it’s to buy a profitable investment. And that requires a detailed understanding of all the levers that affect your bottom line. Ignoring these nuances can lead to overpaying for a property or underestimating the work – and cost – involved in maximizing its revenue potential. A robust ROI analysis is the first step toward making informed decisions and achieving financial success in the short-term rental market.

The data you actually need
Accurate data is the lifeblood of any reliable ROI calculation. Garbage in, garbage out, as the saying goes. You'll need to gather information across three main categories: purchase costs, operating expenses, and revenue projections. Let's break down each one.
Purchase costs are fairly straightforward: the property price itself, plus closing costs (legal fees, title insurance, transfer taxes), and any anticipated renovation or furnishing budget. Be realistic with renovation costs; they almost always exceed initial estimates. Operating expenses are more complex. This includes your mortgage payment (principal and interest), property taxes, insurance, utilities (electricity, water, gas, internet), property management fees (if applicable), cleaning costs, and a budget for ongoing maintenance and repairs. Don't forget to factor in potential vacancy losses.
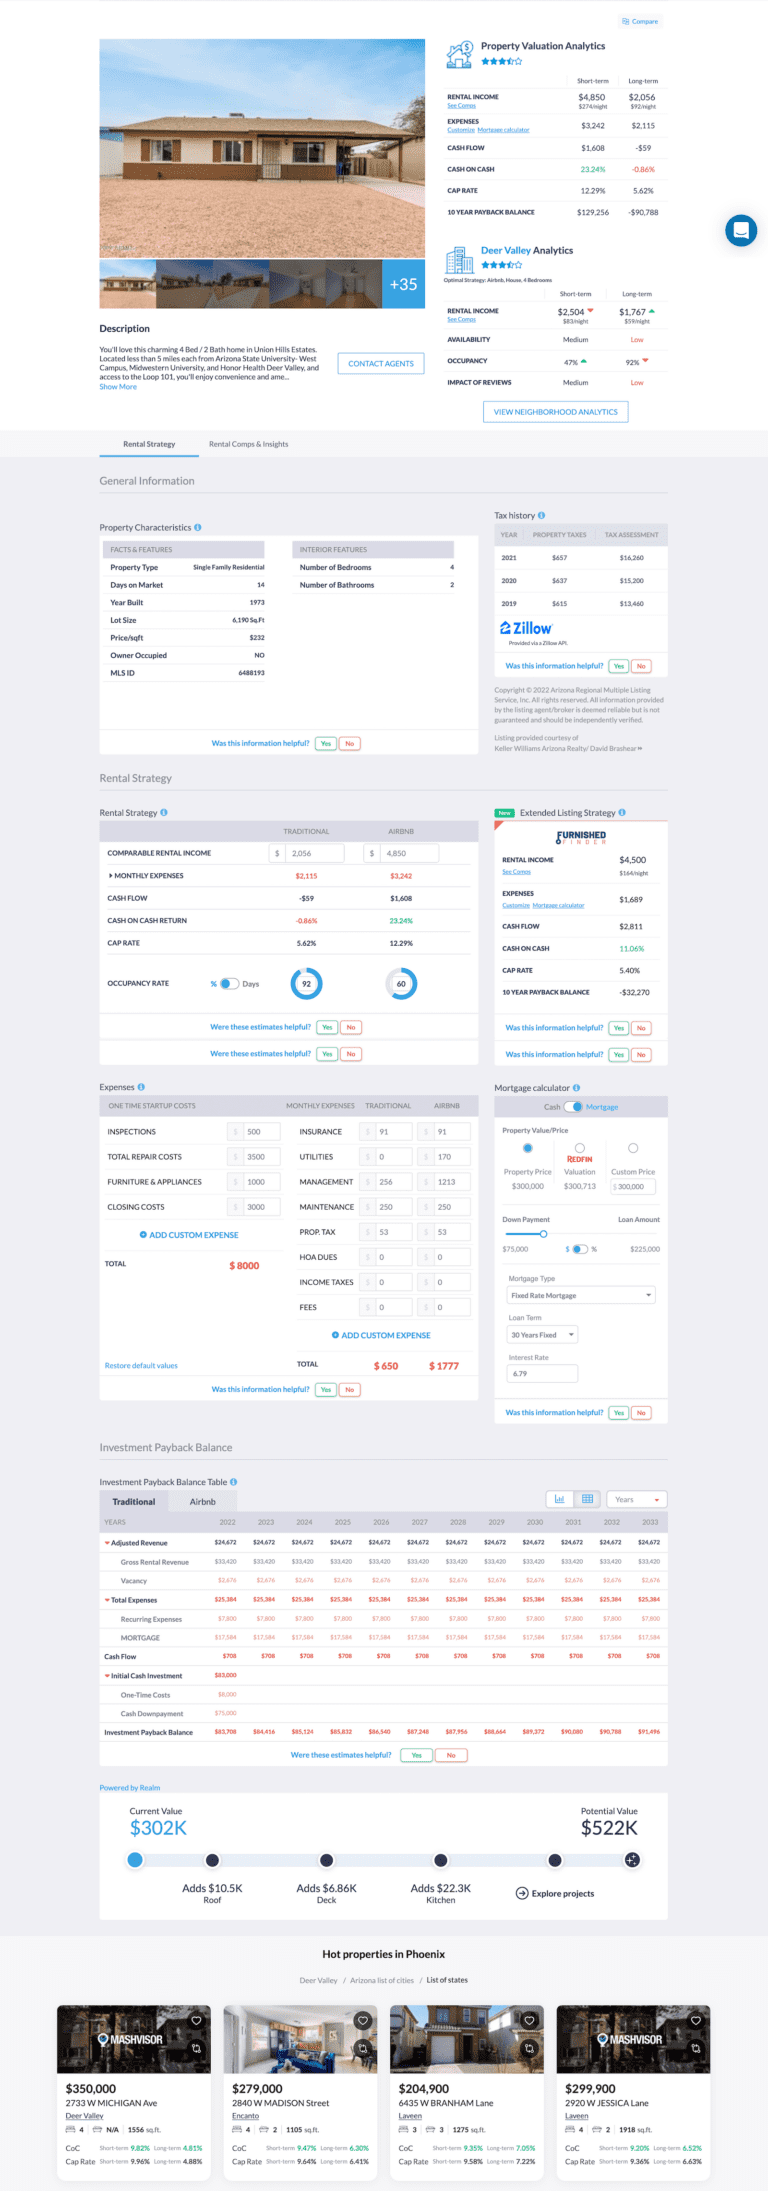
Revenue projections are the trickiest part. You'll need to estimate both your average daily rate (ADR) and your occupancy rate. This is where resources like AirDNA and Rabbu come in handy. These platforms provide data on comparable properties in the area, giving you a benchmark for potential earnings. AirDNA, for example, offers data on occupancy rates, ADRs, and revenue per available rental (RevPAR). Rabbu offers a free Airbnb calculator and market data as well.
However, relying solely on averages can be misleading. It's crucial to consider seasonal variations, local events that might boost demand (festivals, conferences), and the unique amenities of your property. Don't fall into the trap of hoping for 100% occupancy; a realistic estimate is far more valuable. I suggest starting with conservative projections and then creating best-case and worst-case scenarios.
- Purchase costs: Include the sticker price, but also title insurance, transfer taxes, and the furniture budget. I've found that furnishing a three-bedroom home usually costs 15% more than most investors first estimate.
- Operating Expenses: Mortgage, property taxes, insurance, utilities, property management fees, cleaning costs, maintenance.
- Revenue Projections: Average Daily Rate (ADR), Occupancy Rate, Seasonal Variations.
Occupancy and daily rates
Average Daily Rate (ADR) and Occupancy Rate are the two primary drivers of revenue in the short-term rental market. ADR represents the average amount you charge per night, while Occupancy Rate indicates the percentage of nights your property is booked. Mastering these metrics is essential for maximizing your income.
Researching comparable properties is key to estimating realistic ADR and occupancy rates. AirDNA is particularly useful here, allowing you to filter by property type, size, amenities, and location. Look at properties similar to yours and analyze their historical performance. Rabbu also provides market data to assist in this process.
Seasonality plays a significant role. Demand will likely be higher during peak seasons (summer, holidays) and lower during off-peak periods. Local events, such as festivals, concerts, or sporting events, can also create surges in demand. Consider how your property's amenities – a pool, hot tub, proximity to attractions – might influence your ADR and occupancy.
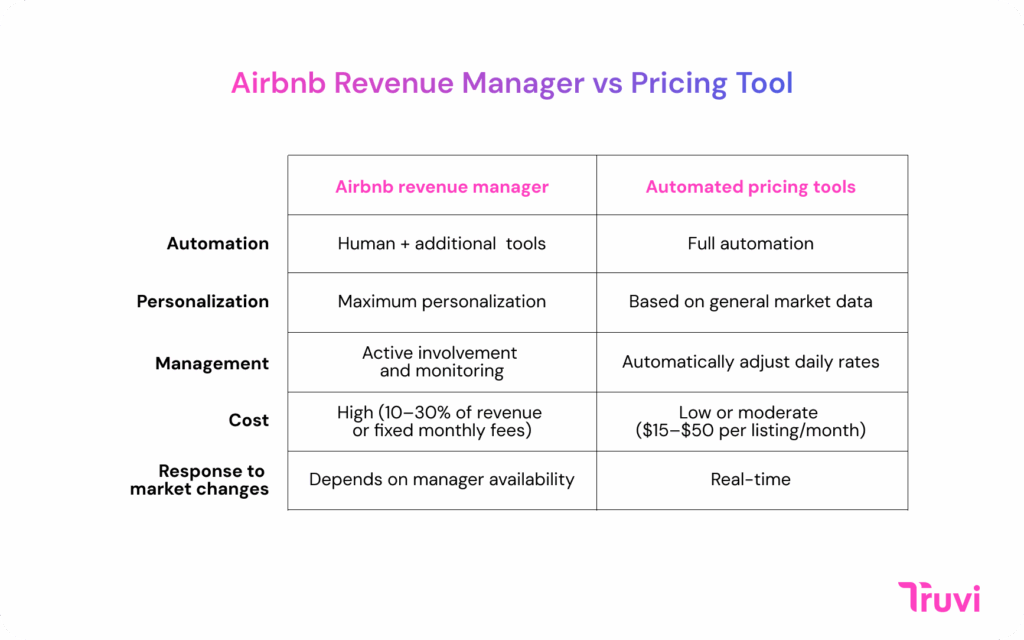
Dynamic pricing strategies, where you adjust your rates based on demand, can significantly boost revenue. Tools like PriceLabs integrate with Airbnb and VRBO to automate this process. However, remember that dynamic pricing can also be complex and requires careful monitoring. Don't be afraid to start with conservative estimates, especially if you're new to the market. It’s better to underestimate and be pleasantly surprised than to overestimate and fall short.
Calculating net operating income
Net Operating Income (NOI) is a crucial metric for evaluating the profitability of an investment property. It represents the revenue generated after deducting all operating expenses, excluding mortgage payments and income taxes. This is important because it allows for a fair comparison between different properties, regardless of their financing structure.
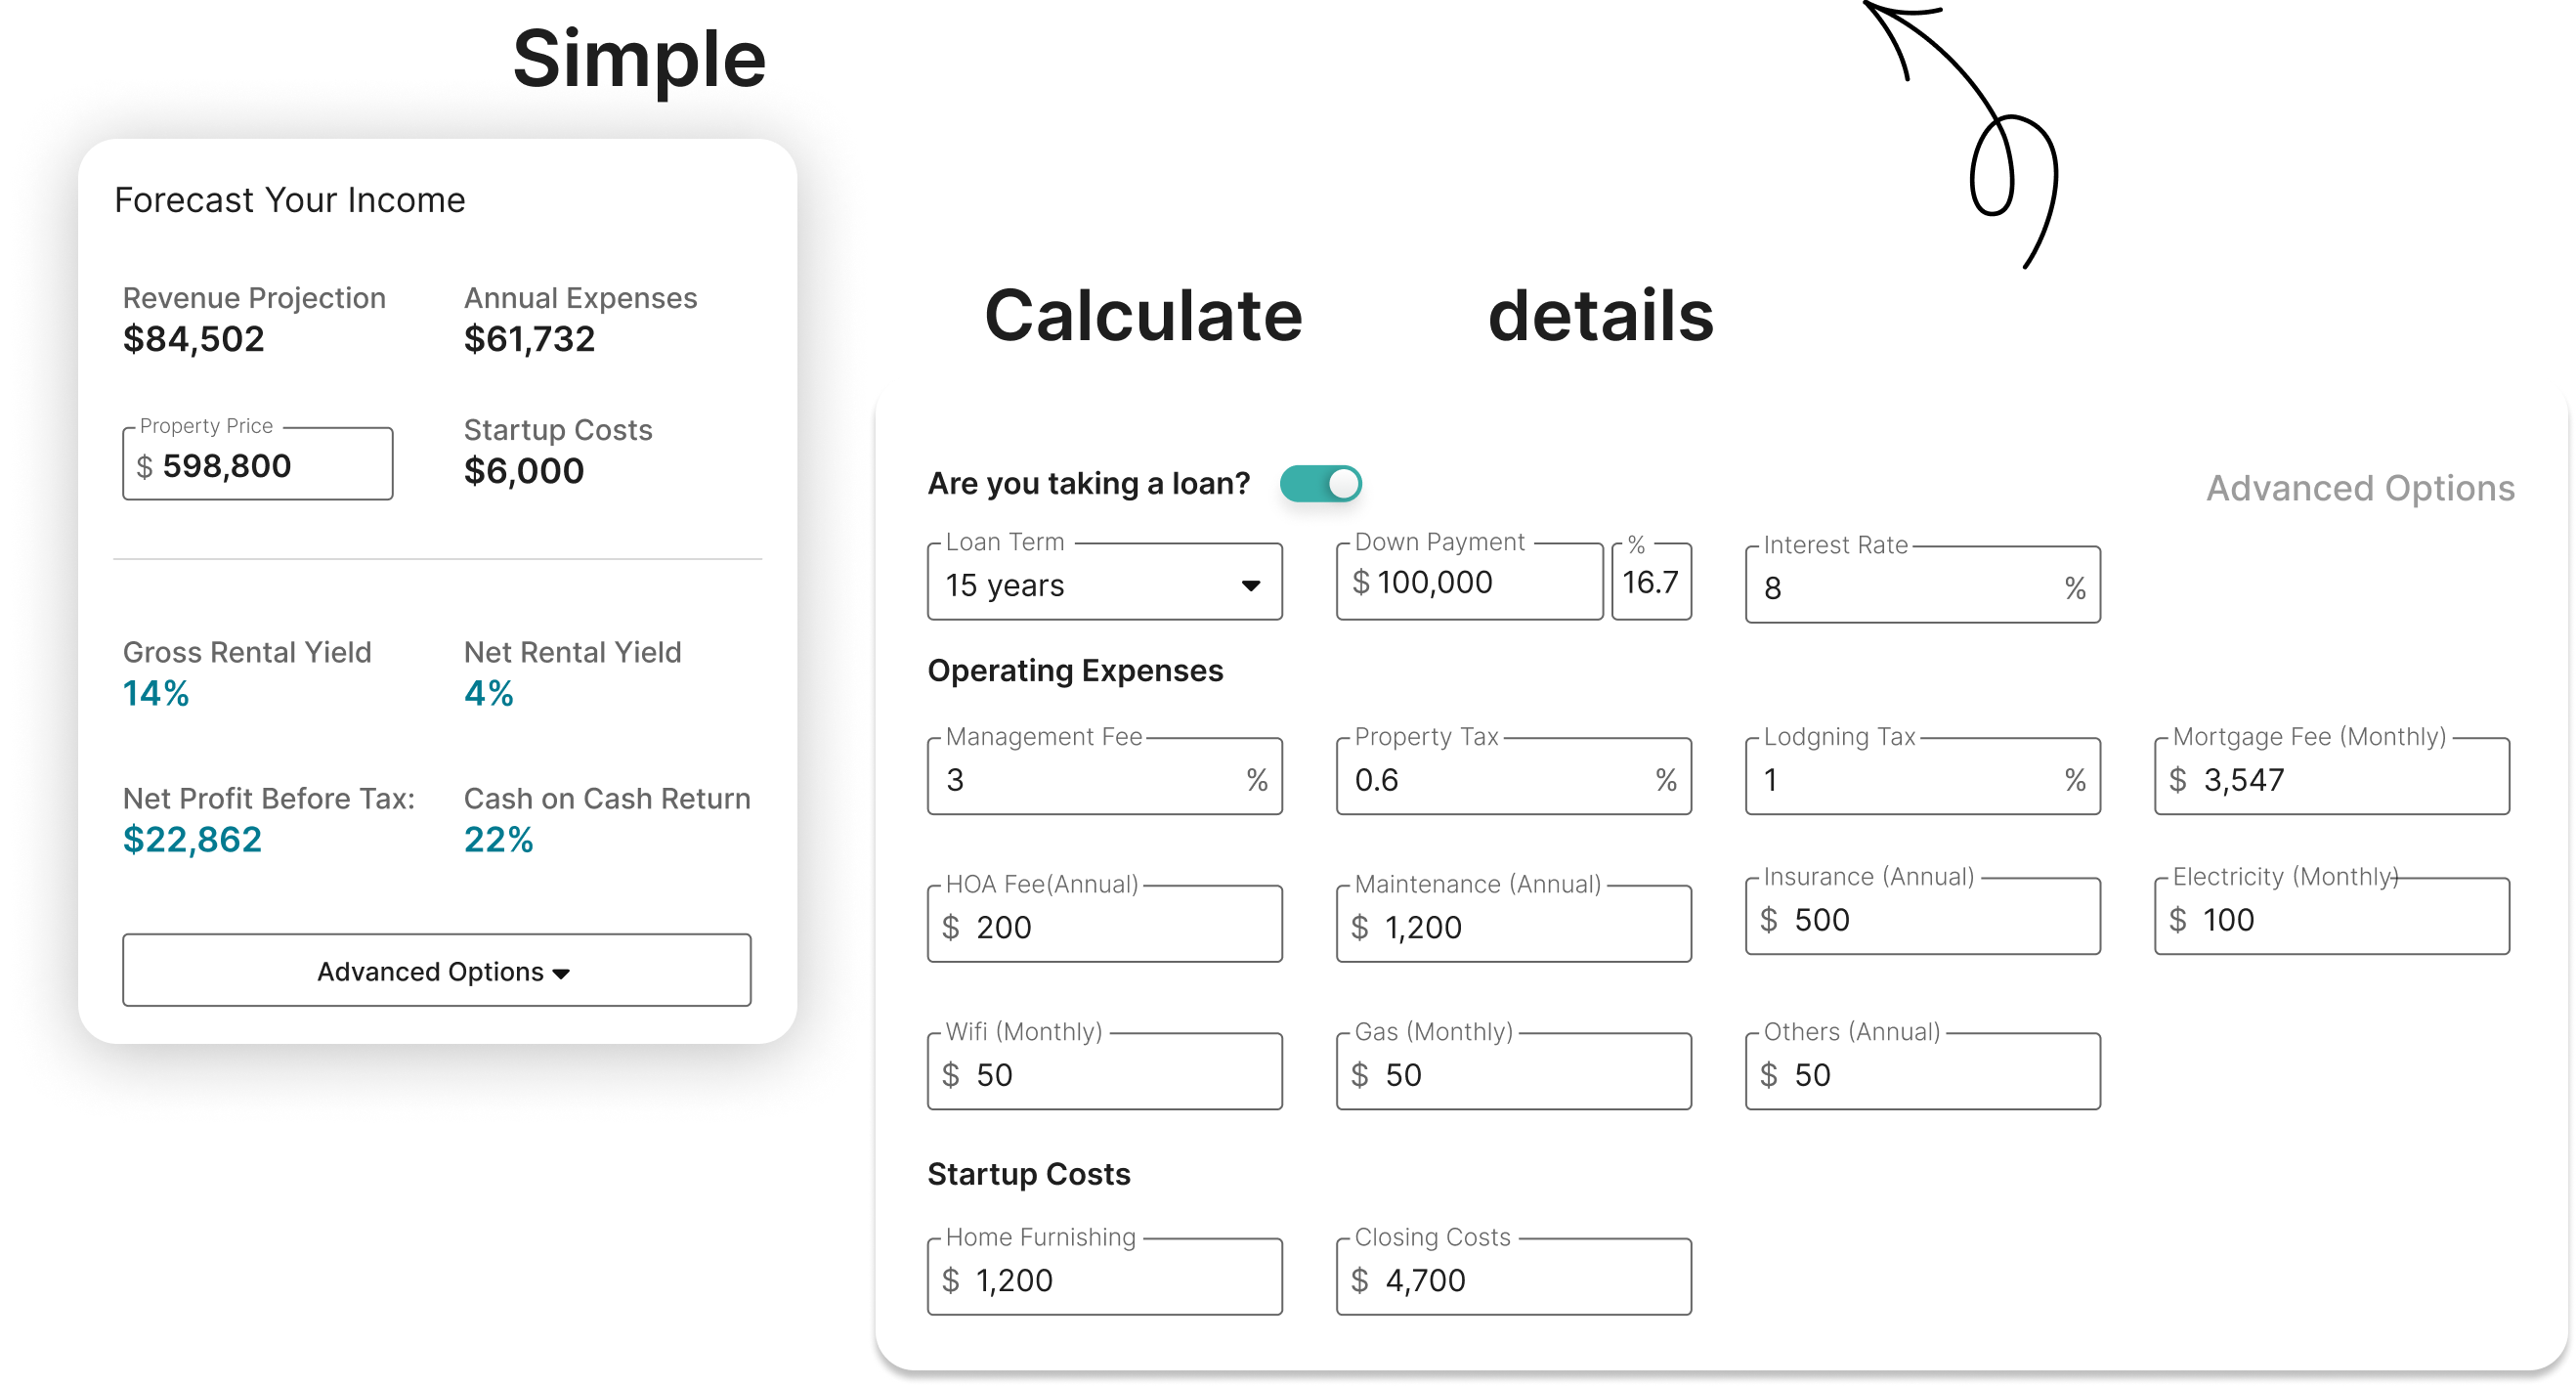
The calculation is straightforward: NOI = Gross Rental Income – Operating Expenses. Gross Rental Income is the total revenue generated from rentals. Operating Expenses include property taxes, insurance, property management fees, utilities, cleaning costs, and maintenance. Let's look at an example: If a property generates $60,000 in gross rental income and has $20,000 in operating expenses, the NOI is $40,000.
NOI is a useful metric for identifying properties with strong potential. A higher NOI generally indicates a more profitable investment. However, it's important to remember that NOI doesn't tell the whole story. It doesn't account for financing costs or income taxes, which can significantly impact your overall return.
Cash Flow & Cash-on-Cash Return: Your Actual Earnings
While NOI provides a valuable overview of profitability, it doesn’t reflect the actual cash you have in your pocket. That’s where Cash Flow comes in. Cash Flow is calculated by subtracting your mortgage payment from your NOI. This represents the amount of money you’re left with after covering all expenses, including debt service.
Cash-on-Cash Return is a particularly useful metric for evaluating investment performance. It measures the annual cash flow relative to the amount of cash you initially invested. The formula is: Cash-on-Cash Return = Annual Cash Flow / Total Cash Invested. Total Cash Invested includes the down payment, closing costs, and any initial renovation expenses.
If you put $50,000 into a deal and it clears $5,000 in profit after all bills are paid, that's a 10% cash-on-cash return. Your mortgage is the biggest lever here. Even a half-point difference in your interest rate can be the difference between a property that pays for itself and one that drains your bank account every month.
Understanding these metrics is vital for making informed investment decisions. Don’t just focus on potential revenue; prioritize properties that generate positive cash flow and a strong Cash-on-Cash Return.
Total ROI and appreciation
Total ROI takes into account the complete picture of your investment, including both cash flow and potential appreciation. Appreciation refers to the increase in the property's value over time. Calculating Total ROI requires estimating the property’s future value and factoring in any capital improvements you make.
The formula for Total ROI is: (Net Profit / Cost of Investment) x 100. Net Profit includes all cash flow received plus any gains from appreciation. It’s important to acknowledge that appreciation is not guaranteed. Market conditions, economic factors, and location all play a role. While historical appreciation rates can provide some guidance, they are not a reliable predictor of future performance.
Capital improvements, such as renovations or upgrades, can increase your property’s value and, therefore, your Total ROI. However, it’s crucial to carefully evaluate the cost-benefit of any capital improvement. Will the increased rental income or property value justify the expense? Consider both short-term and long-term ROI when making these decisions.
A long-term ROI perspective is generally more valuable for real estate investments. While short-term gains can be enticing, the true benefits of real estate often materialize over several years or even decades. Focusing on properties with strong fundamentals and potential for long-term appreciation is a sound investment strategy.
Scenario Planning: Stress-Testing Your Investment
No matter how thorough your initial analysis, unforeseen circumstances can always arise. That’s why scenario planning is so crucial. It involves creating different scenarios based on varying occupancy rates, ADRs, and operating expenses to assess the impact on your ROI. A rental property ROI calculator makes this process much easier.
Create a best-case scenario, assuming high occupancy and ADRs. Then, create a worst-case scenario, assuming low occupancy and increased expenses. Finally, develop a most-likely scenario based on your best estimates. By analyzing these different scenarios, you can get a more realistic understanding of the potential risks and rewards of your investment.
For example, what if occupancy drops by 20% due to increased competition? Or what if property taxes increase unexpectedly? How would these changes affect your cash flow and ROI? A sensitivity analysis, where you systematically vary different inputs to see their impact, can be particularly helpful. This allows you to identify the key drivers of your ROI and focus on mitigating potential risks.
Having a contingency plan is essential. What will you do if your property doesn’t perform as expected? Do you have a reserve fund to cover unexpected expenses? Are you prepared to adjust your pricing or marketing strategy? Proactive planning can help you navigate challenges and protect your investment.
Short-Term Rental Investment Strategies: Risk, ROI & Management Effort (2026 Outlook)
| Strategy | Risk Level | Potential ROI | Occupancy Rate | Management Effort |
|---|---|---|---|---|
| High-End Luxury | Medium to High | 10-20% | 60-80% | Medium to High |
| Budget-Friendly | Low to Medium | 8-15% | 70-90% | Low to Medium |
| Family-Focused (3+ Bedrooms) | Low | 7-12% | 65-85% | Medium |
| Pet-Friendly | Medium | 9-17% | 68-88% | Medium |
| Urban/City Center | Medium | 12-18% | 65-75% | Medium to High |
| Rural/Remote Location | High | 15-25% | 40-60% | Low to Medium |
| Coastal Properties | Medium | 10-16% | 75-95% | Medium |
Illustrative comparison based on the article research brief. Verify current pricing, limits, and product details in the official docs before relying on it.
No comments yet. Be the first to share your thoughts!