
Record occupancy in Q2 2026
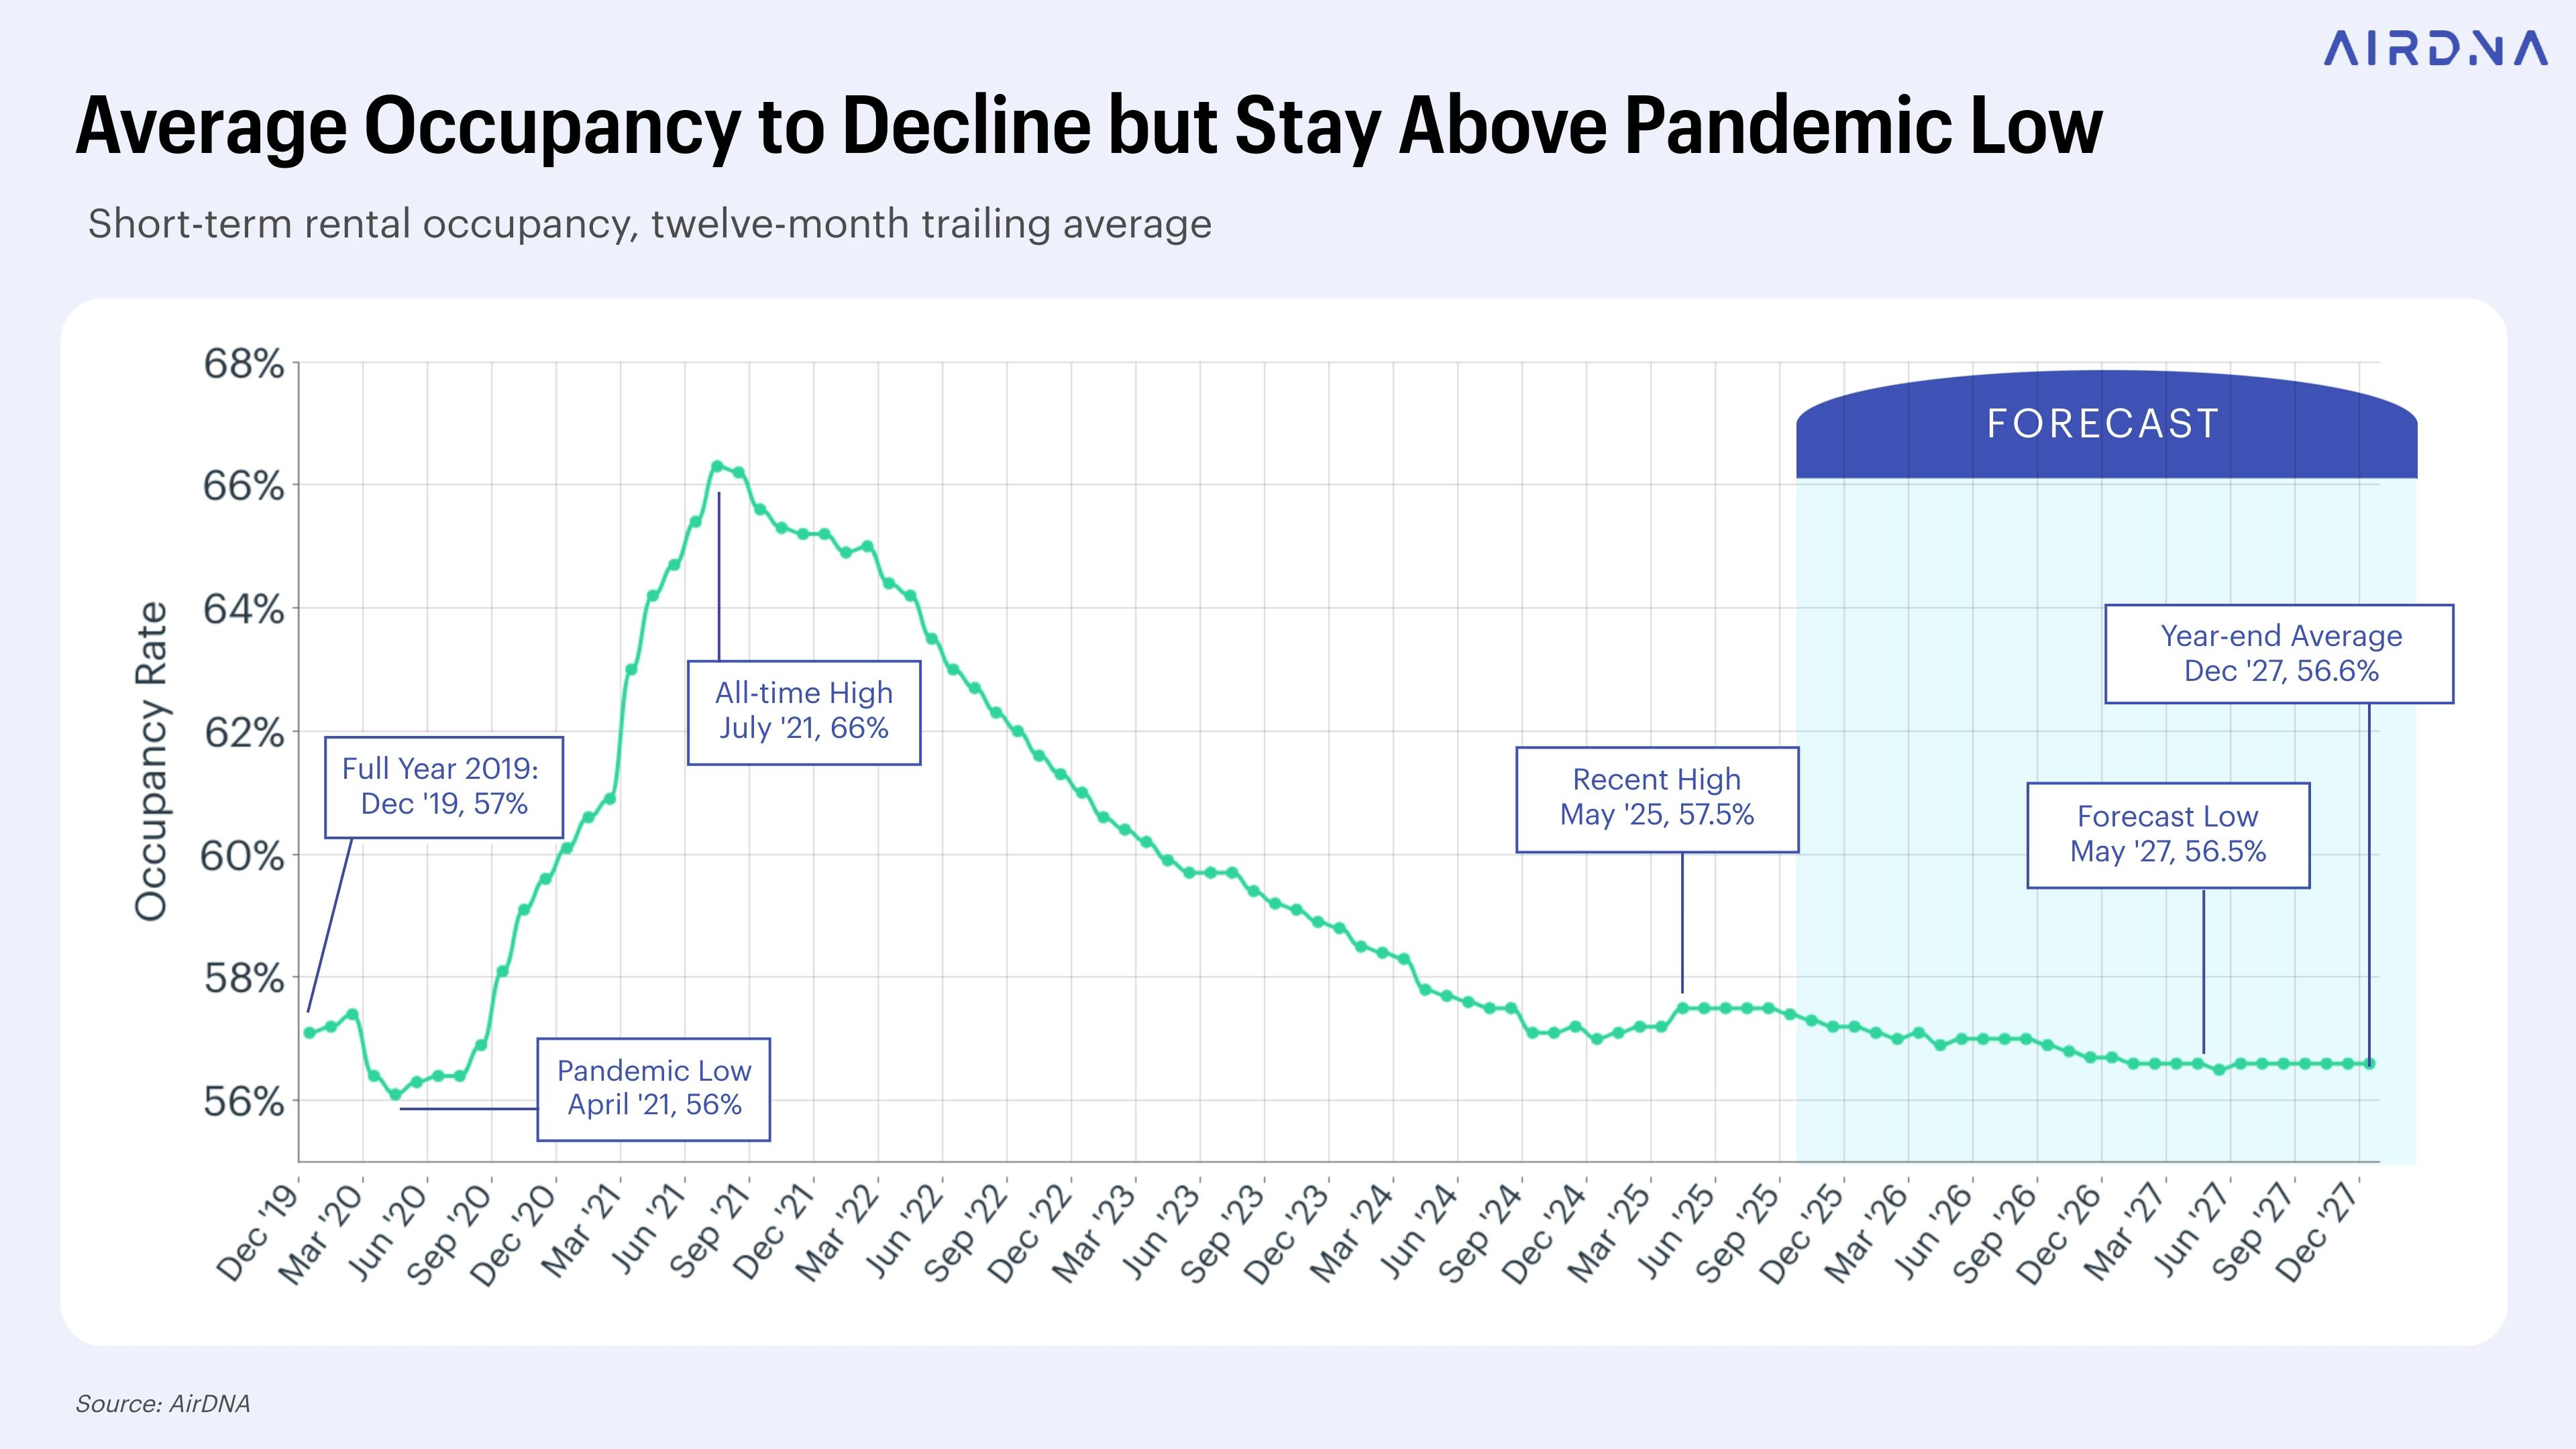
Airbnb occupancy is up. AirDNA data shows a 12.7% increase across all markets in Q2 2026 compared to last year. This jump suggests the short-term rental market is moving faster than many expected.
The US Sunbelt continues to be a primary driver of this growth, with cities like Phoenix, Austin, and Tampa Bay seeing occupancy rates exceeding 85%. However, we’re also observing strong gains in European destinations, particularly in Southern Europe – Lisbon, Barcelona, and the Greek Islands are experiencing a renaissance in tourism. This is likely fueled by a combination of factors, including relatively affordable pricing compared to Northern Europe and increased accessibility.
These numbers are a snapshot. Economy shifts or bad weather can change things quickly, but the current trend is strong. Demand for rentals is holding up even as other parts of the economy look shaky.
What is driving demand?
The surge in Airbnb occupancy isn’t happening in a vacuum. A key factor is the continued release of pent-up travel demand following the pandemic. People are eager to travel, and vacation rentals offer a compelling alternative to traditional hotels, often providing more space, privacy, and value.
Economic considerations also play a role. With inflation impacting various sectors, many travelers are actively seeking cost-effective options. Vacation rentals can often be more affordable than hotels, especially for families or groups. This is particularly true when factoring in the ability to cook meals and avoid expensive restaurant bills.
A noticeable shift in travel preferences is also contributing to the growth. The rise of remote work has enabled a new segment of travelers – digital nomads – who prioritize flexibility and extended stays. Simultaneously, major events like the Summer Olympics in Los Angeles and several large-scale music festivals are concentrating demand in specific locations, driving up occupancy rates and ADR.
Hot Markets: Where’s the Growth?
Phoenix leads the US with 87.2% occupancy, followed by Austin at 86.5% and Tampa at 85.8%. These cities have the right mix of jobs and tourism to keep beds filled.
However, several emerging markets are also experiencing significant growth. According to Airbtics, Nashville, Tennessee, has seen a 22% increase in occupancy year-over-year, driven by its thriving music scene and growing popularity as a tourist destination. Similarly, Boise, Idaho, is attracting attention due to its affordability and access to outdoor activities.
The success of these markets isn’t accidental. Affordability is a key factor, especially in cities like Nashville and Boise. Unique attractions, such as the live music scene in Nashville or the outdoor recreation opportunities in Boise, also draw visitors. Proximity to major hubs – Phoenix’s proximity to Los Angeles, for example – can also contribute to growth. Seasonality is also crucial; coastal markets naturally peak during the summer months.
It's important to note that these markets aren't immune to saturation. Investors should carefully analyze local regulations and competition before making any decisions.
Top 10 Markets by Airbnb Occupancy Rate Increase (Q2 2025 vs. Q2 2026)
| City | State/Country | Occupancy Rate (2025) | Occupancy Rate (2026) | Percentage Change | Average Daily Rate (2026) |
|---|---|---|---|---|---|
| Nashville | Tennessee | 68.2% | 79.5% | 16.6% | $215 |
| Miami | Florida | 72.5% | 83.1% | 14.4% | $285 |
| Phoenix | Arizona | 65.8% | 75.2% | 14.2% | $180 |
| Austin | Texas | 70.1% | 80.0% | 14.1% | $230 |
| Denver | Colorado | 63.9% | 72.8% | 13.9% | $205 |
| New Orleans | Louisiana | 66.5% | 75.7% | 13.8% | $190 |
| Savannah | Georgia | 69.4% | 78.9% | 13.7% | $220 |
| Charleston | South Carolina | 71.3% | 81.0% | 13.6% | $255 |
Illustrative comparison based on the article research brief. Verify current pricing, limits, and product details in the official docs before relying on it.
Daily rates and revenue growth
Increased occupancy is only part of the equation. The real story lies in the combined impact of occupancy and Average Daily Rate (ADR). Fortunately, ADR is also on the rise, although the rate of increase varies by market. AirDNA reports a global average ADR increase of 8.3% in Q2 2026 compared to Q2 2025.
In high-demand markets like Phoenix and Austin, ADR has increased by as much as 15%, allowing hosts to capitalize on the limited supply of available rentals. However, some markets are seeing hosts prioritize occupancy over price, resulting in more modest ADR increases. This strategy can be effective in attracting a wider range of travelers.
Properties that have successfully optimized their pricing strategy are reaping the rewards. For example, a two-bedroom condo in Scottsdale, Arizona, increased its revenue by 35% in Q2 2026 by implementing dynamic pricing based on demand and seasonality. Overall revenue growth for Airbnb hosts and investors is substantial, with many reporting record earnings.
Investment Implications: What to Buy?
The current market conditions present a compelling opportunity for investors, but choosing the right property is crucial. Smaller condos and townhouses are generally performing well, particularly in urban areas. These properties are often more affordable and appeal to a wider range of travelers.
Properties with desirable amenities are also in high demand. Pools, hot tubs, and pet-friendly accommodations consistently command higher prices and occupancy rates. Smart home features, such as keyless entry and voice-controlled assistants, are also becoming increasingly popular.
Location remains paramount. Proximity to attractions, transportation, and essential services is essential. However, investors should also consider the local regulatory environment. Some cities have strict regulations on short-term rentals, which can impact profitability. Thorough due diligence is critical.
It’s also important to be realistic about the risks. Market saturation is a concern in some areas. Competition is fierce. Investors should diversify their portfolios and avoid overleveraging. A well-managed property with a strong marketing strategy is more likely to succeed.
Beyond the Headlines: Emerging Trends
Looking beyond the immediate numbers, several emerging trends are shaping the future of the Airbnb market. We’re seeing a noticeable shift towards longer stays, as remote workers and digital nomads seek out extended accommodations. This trend is driving demand for properties with more space and amenities.
There’s also increased demand for unique accommodation types, such as glamping sites, tiny homes, and converted shipping containers. Travelers are seeking out experiences that are different from traditional hotels. Airbnb’s own initiatives, like Airbnb Luxe and Airbnb for Work, are catering to these evolving preferences.
Technology is playing an increasingly important role. Smart home integration is enhancing the guest experience. Dynamic pricing tools are helping hosts optimize their revenue. Data analytics platforms are providing valuable insights into market trends. These technologies are empowering hosts to make informed decisions and maximize their returns.
Tools for Tracking & Optimization
To succeed in the Airbnb market, investors need access to the right tools. BNB Stats provides comprehensive Airbnb market data, rental analytics, and investment insights. AirDNA offers detailed occupancy rates, ADR data, and revenue projections. Airbtics provides a user-friendly interface for analyzing market trends and identifying profitable opportunities.
These tools allow you to track occupancy rates, analyze competitor pricing, and optimize your own pricing strategy. They also provide valuable insights into market demand and emerging trends. Data-driven decision-making is essential for maximizing your returns.
- BNB Stats: Comprehensive market data and investment insights
- AirDNA: Detailed occupancy rates and revenue projections
- Airbtics: User-friendly market analysis tools
Essential Investor Tools
- BNB Stats - Provides comprehensive Airbnb market data, rental analytics, and investment insights. Focuses on occupancy rates, pricing trends, and revenue optimization strategies for informed decision-making.
- AirDNA - Offers detailed short-term rental data, including occupancy rates, average daily rates (ADR), and revenue per available rental (RevPAR). Provides market comparisons and forecasting capabilities.
- Airbtics - A data analytics platform specializing in Airbnb and short-term rental performance. Features include market analysis, competitive benchmarking, and portfolio tracking.
- AllTheRooms Analytics - Aggregates data from multiple vacation rental platforms (including Airbnb, VRBO, and Booking.com) to provide a holistic view of market performance and demand.
- Mashvisor - A real estate investment platform that includes Airbnb analytics. Helps investors identify profitable properties and estimate potential rental income.
- Transparent - Focuses on providing insights into short-term rental market trends, including demand, supply, and pricing. Offers data for individual properties and entire markets.
- Hosttools - Designed to help Airbnb hosts and property managers automate tasks and optimize their listings. Includes features for dynamic pricing, channel management, and guest communication.
No comments yet. Be the first to share your thoughts!