
Pick the right analytics platform
Choosing the correct data source is the first step in validating a short-term rental investment. Free aggregators offer a quick snapshot of market health, but they often lack the granularity needed for accurate revenue projections. Paid professional tools provide deeper historical data, competitor analysis, and dynamic pricing insights that justify their subscription costs for serious investors.
Free vs. Paid Tools
Free platforms like Inside Airbnb rely on publicly available data, which is useful for understanding general occupancy trends but may lag behind real-time market shifts. Paid services such as AirDNA or Rabbu aggregate data from multiple sources, including direct host reporting, to offer more precise revenue estimates and occupancy forecasts. For a single property, a free tool might suffice for initial research, but scaling your portfolio requires the predictive power of paid analytics.
Platform Comparison
The table below compares three leading platforms based on data depth, cost structure, and primary use cases. Selecting the right tool depends on whether you need broad market overviews or specific property-level performance metrics.
| Platform | Cost | Data Depth | Best For |
|---|---|---|---|
| AirDNA | Freemium (Paid plans start ~$10/mo) | High (10M+ rentals, 120K markets) | Comprehensive market analysis and competitor tracking |
| Rabbu | Free basic, Paid for advanced | Medium (Real-time US market focus) | Quick US market checks and occupancy rates |
| AirROI | Free analytics, Paid API | Medium (20M+ properties tracked) | Developers and those needing API access |
Analyze local occupancy and revenue trends
Occupancy rate and average daily rate (ADR) are the twin engines of short-term rental income. Occupancy measures the percentage of nights booked, while ADR tracks the average price paid per night. Together, they determine gross revenue, but neither metric tells the whole story on its own.
A high ADR with low occupancy often signals overpricing or a niche market with limited demand. Conversely, high occupancy with a low ADR may indicate a volume strategy that fails to cover operating costs. You need both metrics to identify a viable investment opportunity.
Pull data for the target zip code
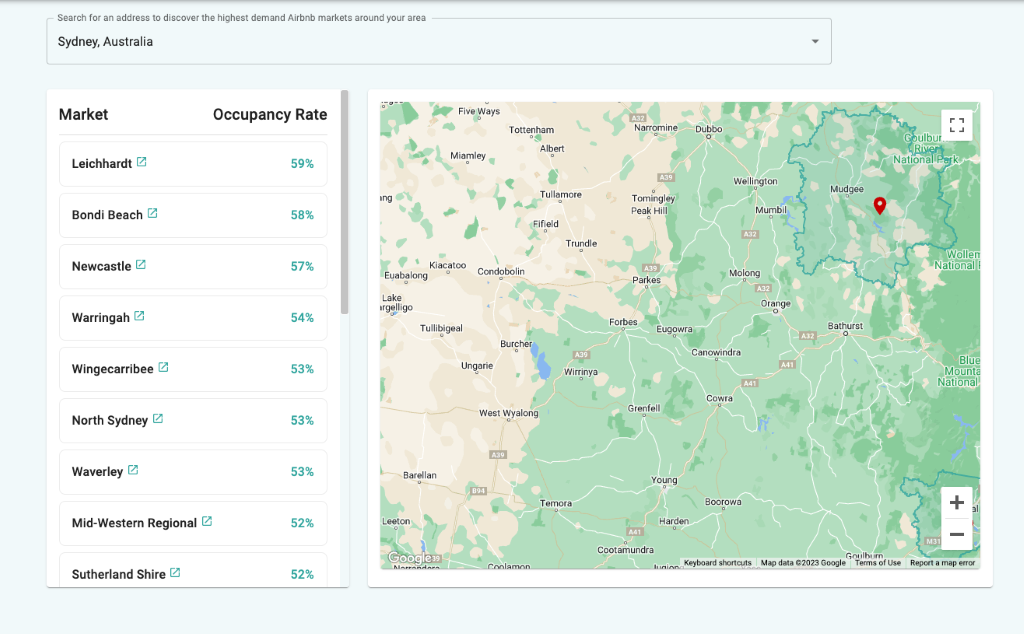
Start by isolating data for the specific zip code or neighborhood you are considering. Broad city-wide averages can mask hyper-local trends. Tools like Airbnb Market Data by Mashvisor or Awning provide granular insights by location. Look for platforms that offer real-time or near-real-time updates, as market conditions shift quickly.
Identify the exact zip code or neighborhood. Narrowing your focus ensures the data reflects the specific demand drivers of your target property, such as proximity to tourist attractions or business districts.
Use a reliable data source to pull the last 12 months of occupancy rates and ADR. Annual data smooths out seasonal spikes and dips, giving you a realistic baseline for annual revenue projections.
Multiply the monthly ADR by 30, then multiply that result by the occupancy rate. This gives you a monthly gross revenue estimate. Repeat for 12 months to annualize the figure. This number is your starting point for profitability analysis.
Interpret the metrics for viability
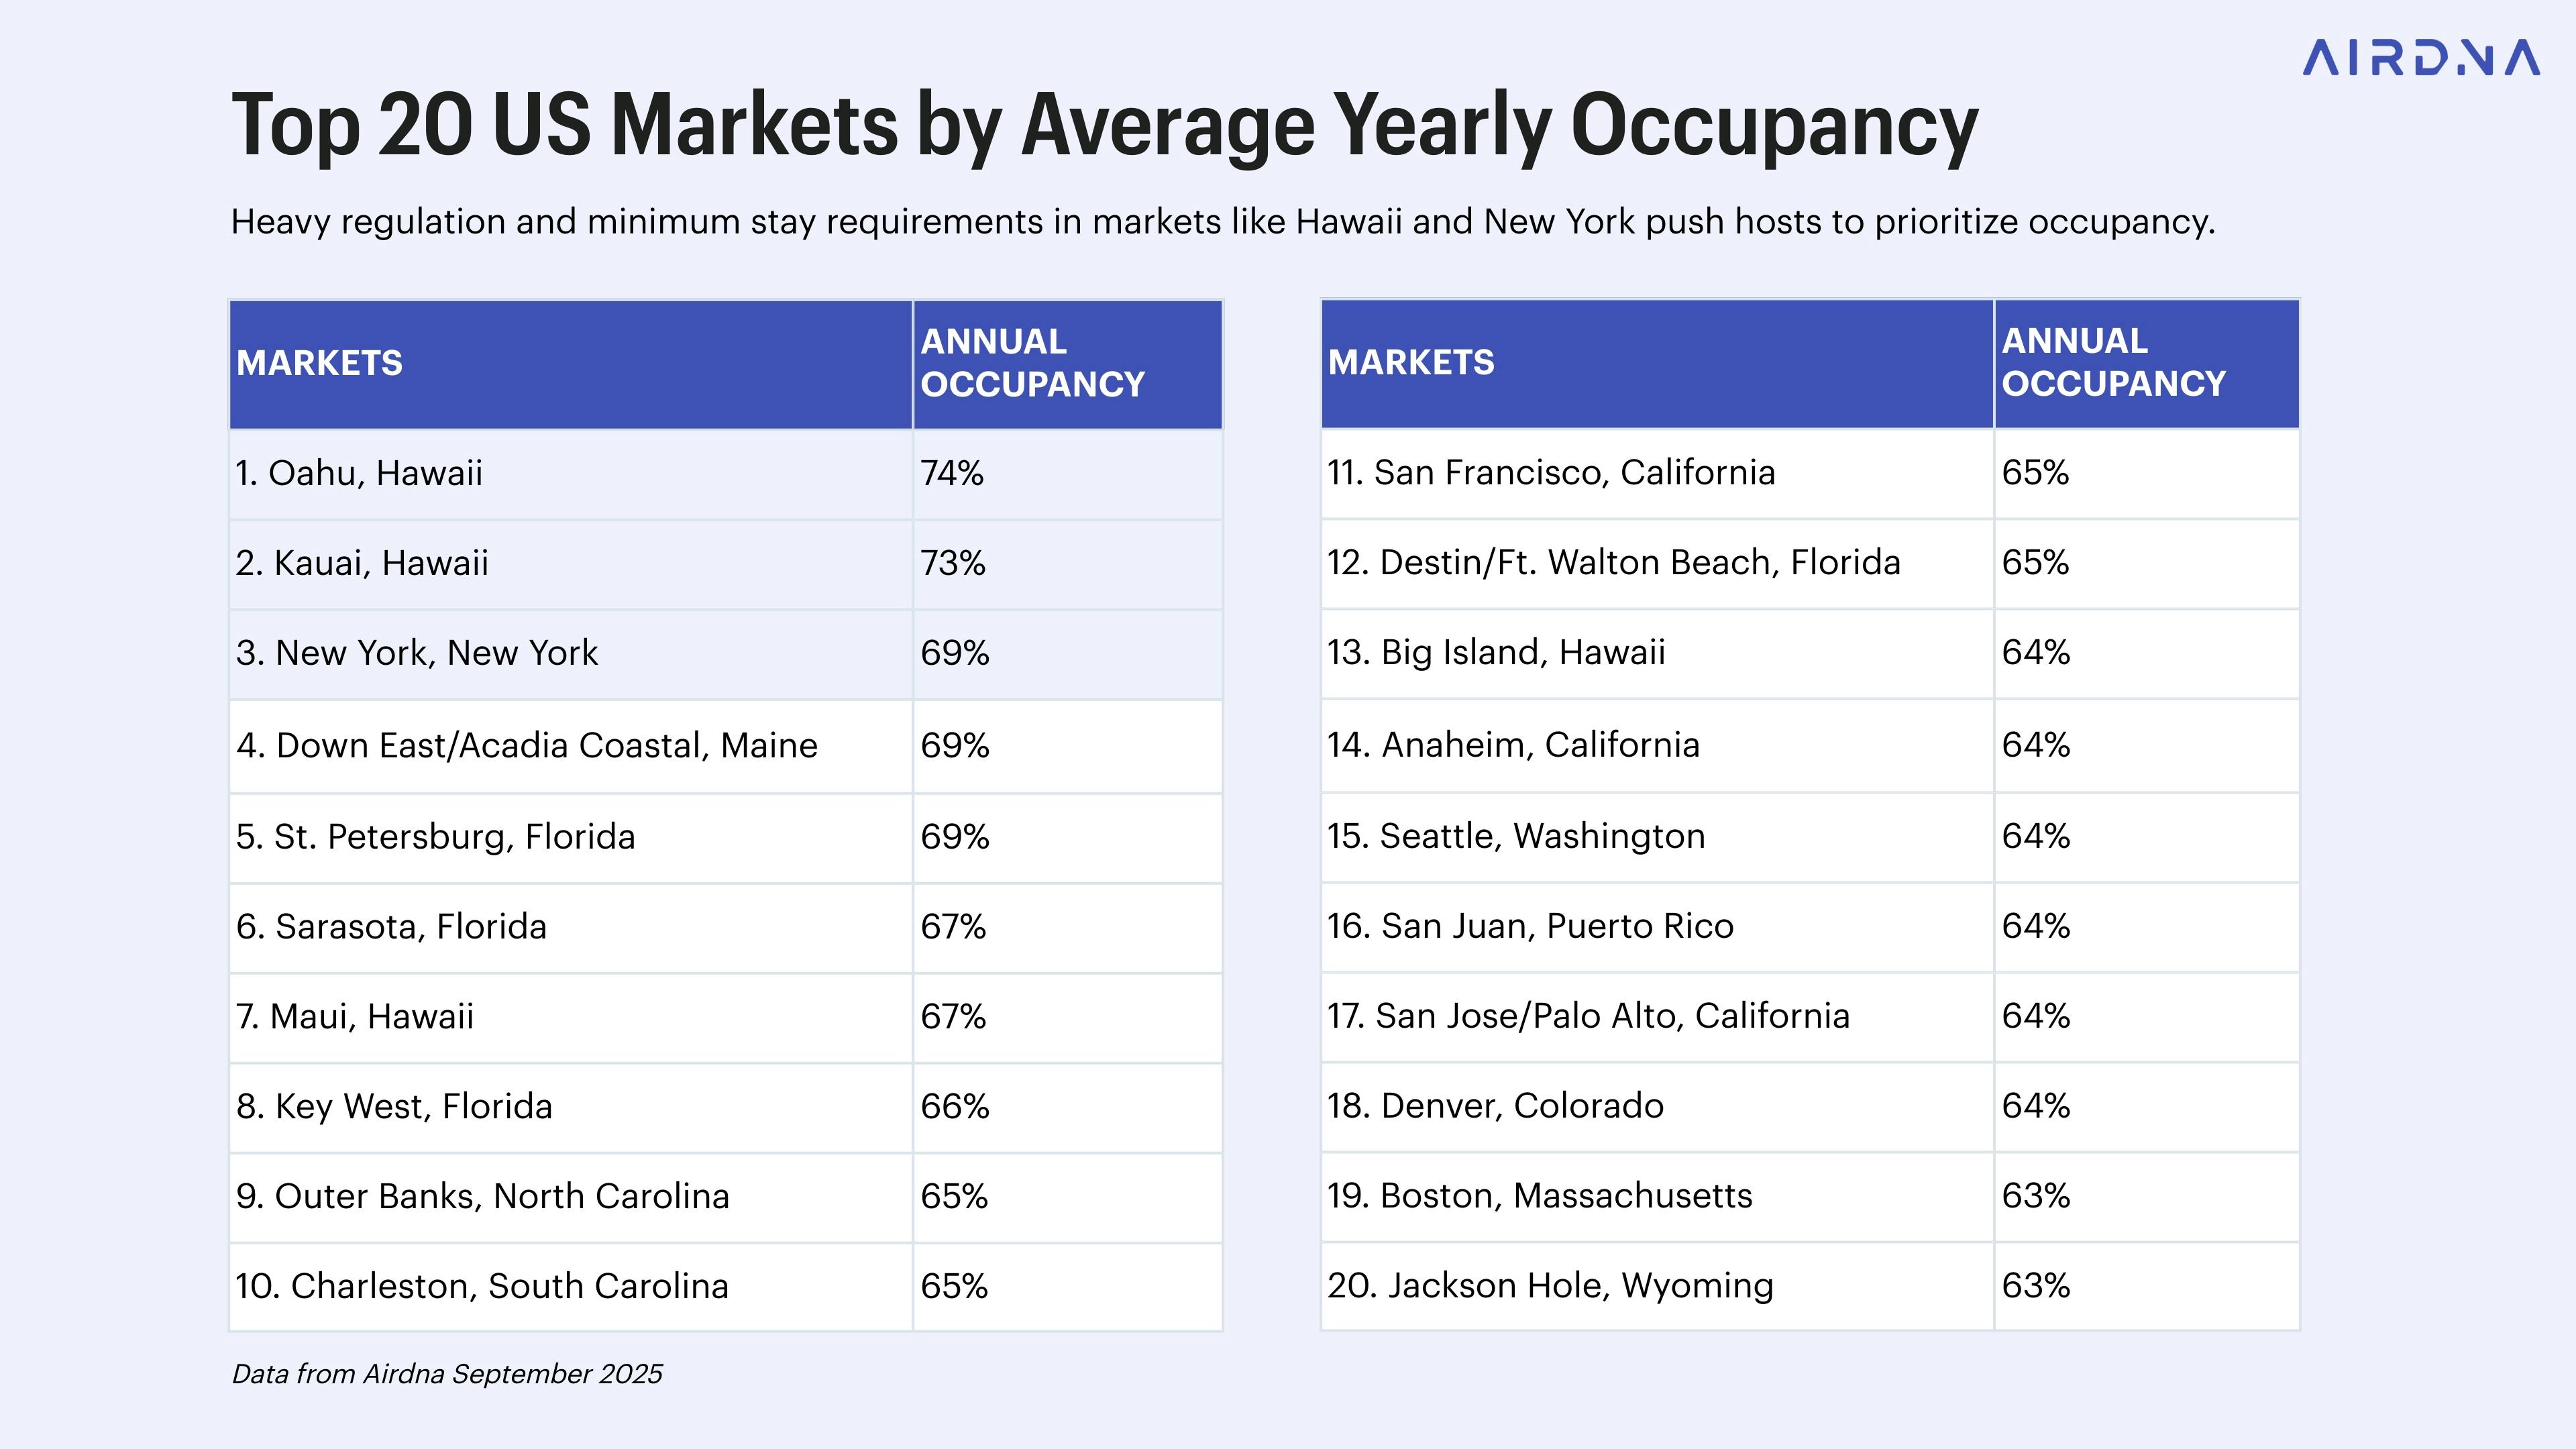
Once you have the numbers, compare them against your investment criteria. A typical healthy occupancy rate for a well-located property often falls between 60% and 75%, but this varies by season. If the data shows consistent occupancy below 50%, the market may be saturated or the location lacks demand.
Check the ADR stability. Does the rate fluctuate wildly month-to-month? Consistent ADR suggests a stable market, while extreme volatility can make cash flow planning difficult. If the data seems sparse or outdated, consider supplementing it with public listings from Inside Airbnb for a manual cross-check of active inventory and pricing.
Factor in seasonality and expenses
Revenue is not static. Look at the month-by-month breakdown to identify peak and off-peak seasons. A property that performs well in summer but sits empty in winter requires a different financial strategy than one with year-round demand. Adjust your revenue projections to reflect these seasonal lows.
Finally, subtract estimated expenses from your gross revenue. These include cleaning fees, property management costs, utilities, and platform commissions. If the net income does not meet your desired return on investment, the market may not be viable, regardless of how strong the occupancy numbers look.
Calculate realistic property ROI
Raw market data is only useful if you can translate it into a concrete Return on Investment figure. To do this, you need to move beyond gross revenue estimates and build a model that accounts for the full cost of ownership. This process turns abstract occupancy rates into a clear picture of cash flow.
Start by identifying the Average Daily Rate (ADR) and occupancy rate for your target neighborhood. Multiply these figures to get the estimated annual gross revenue. This number represents the total income before any expenses are deducted.
Next, subtract all operating expenses. This includes property management fees, cleaning costs, utilities, insurance, taxes, and maintenance reserves. A common rule of thumb is to set aside 20-30% of gross revenue for these variable costs. The result is your Net Operating Income (NOI).
Finally, divide the NOI by your total cash investment (down payment, closing costs, and initial furnishing). This gives you the cash-on-cash return. This metric is the most reliable indicator of whether the property will actually generate profit.
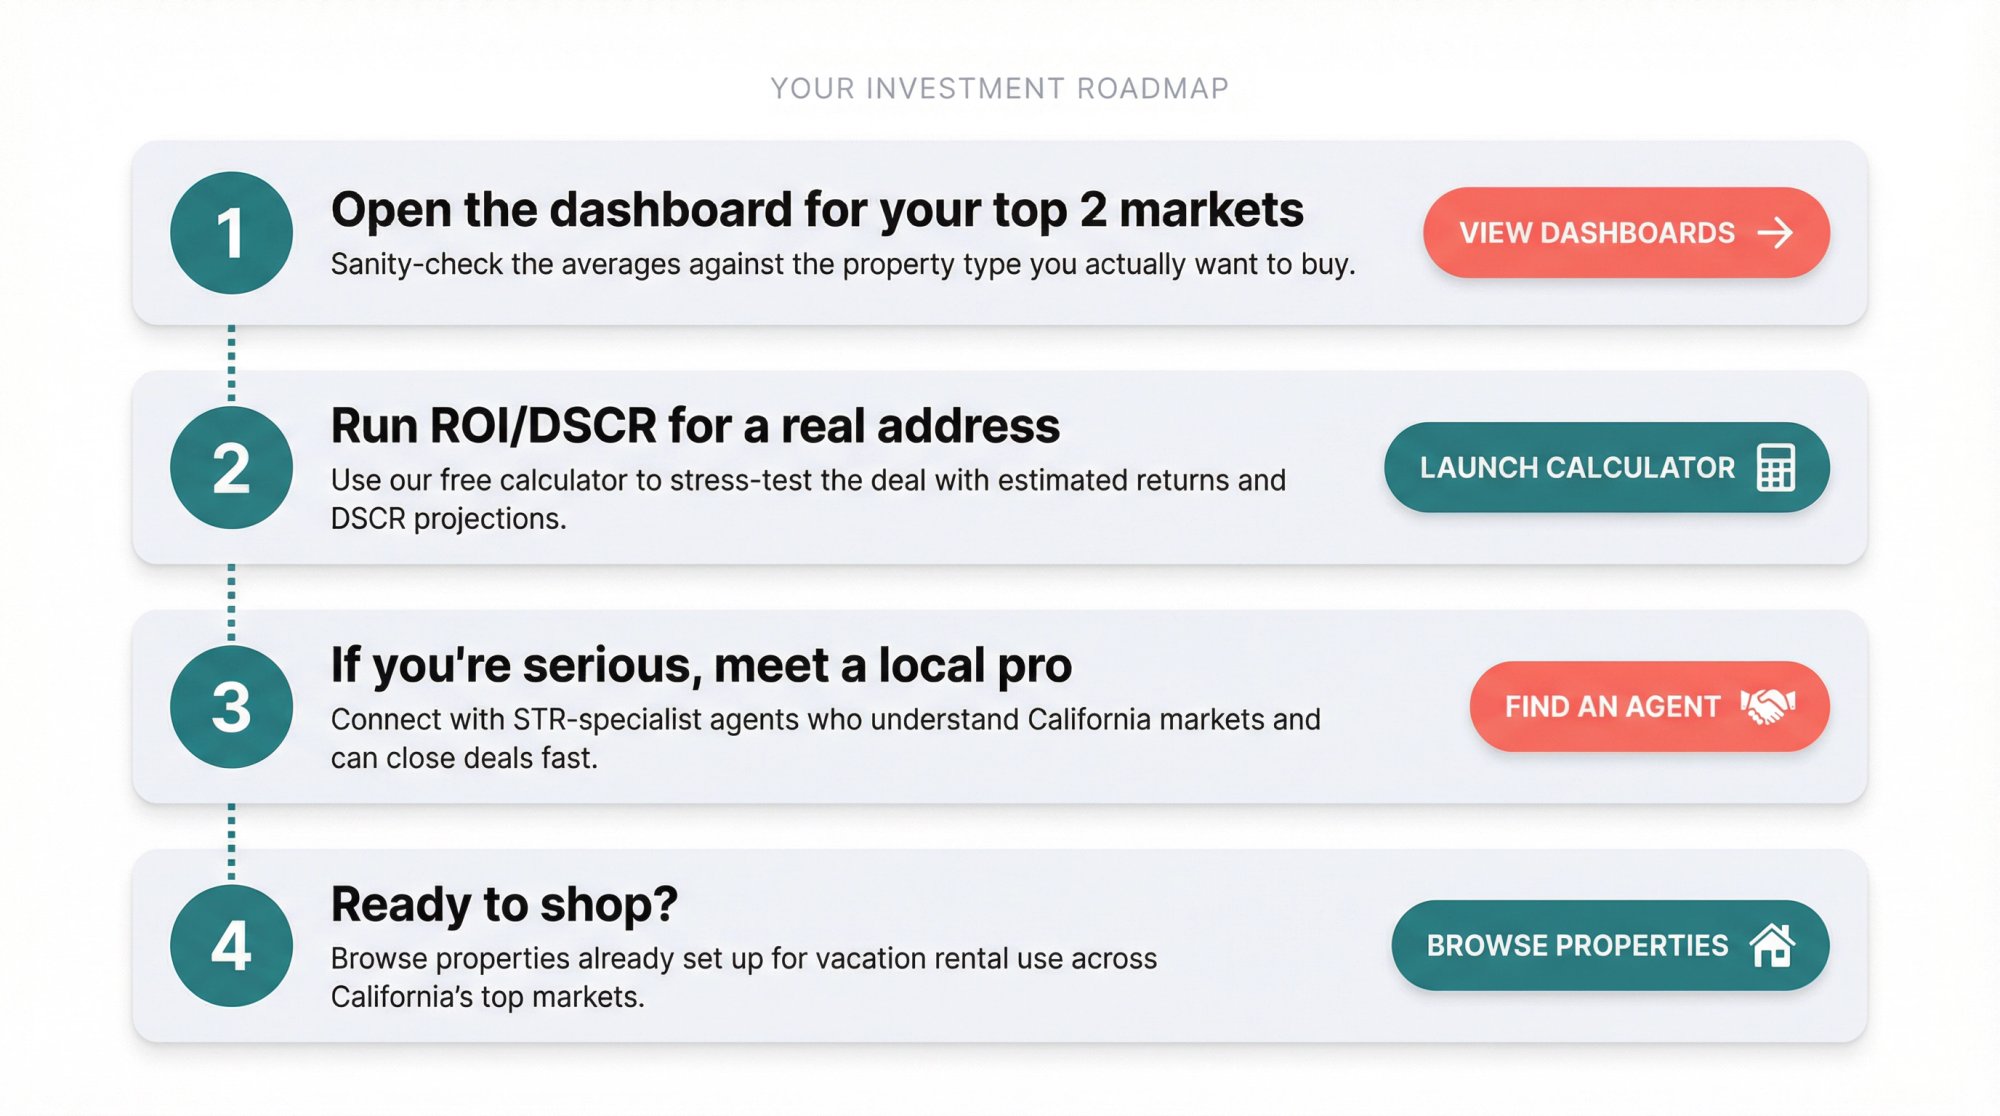
Use a rental property ROI calculator to automate these steps. Input your local market data to test different scenarios, such as adjusting for seasonal fluctuations or higher vacancy rates. This allows you to make data-driven decisions rather than guessing.
Verify data against local regulations
Market data reveals what is possible, but local regulations determine what is legal. Relying on occupancy rates or average daily rates without checking zoning laws is a high-stakes error. Many cities have banned short-term rentals entirely in residential zones or restricted them to owner-occupied units. Before committing capital, you must confirm that the specific property type is permitted for short-term stays.
Start by consulting the city’s planning or zoning department website. Look for codes regarding "short-term rentals," "vacation rentals," or "transient occupancy." These documents will specify if a license is required, whether there are caps on the number of rental days per year, and if any special inspections are mandated. Some jurisdictions require a business license or a certificate of occupancy specifically for short-term use.
Do not rely on third-party platforms or informal advice. Airbnb’s own data, while useful for trend analysis, does not reflect local legal constraints. For instance, data from Inside Airbnb may show high demand in a neighborhood, but that demand is irrelevant if the city has prohibited non-hosted stays. Always cross-reference market potential with official municipal codes to avoid fines or forced shutdowns.
Finalize your investment checklist
Before signing a purchase agreement, verify that every data point aligns with your risk tolerance and capital constraints. Short-term rental success relies on validating market demand against local regulatory realities and financial projections.
Use the following checklist to ensure no critical metric is overlooked during due diligence.
-
Confirm local zoning and STR permit requirements with the city planning department.
-
Validate occupancy and average daily rate (ADR) projections using at least two data platforms like AirDNA or Rabbu.
-
Calculate the debt service coverage ratio (DSCR) to ensure cash flow covers mortgage payments.
-
Review the property management fee structure and compare it against projected net operating income.
-
Check for any pending special assessments or HOA restrictions on short-term rentals.
Is Airbnb data available for free?
Yes, Airbnb data is available for free, but with significant limitations. The most accessible source is Inside Airbnb, which aggregates and cleanses publicly available listing information from Airbnb’s site. This data allows you to analyze inventory levels, occupancy rates, and pricing trends without paying for a subscription.
However, free data is not the same as raw, real-time data. Inside Airbnb updates its datasets periodically—often monthly or quarterly—depending on the city. This lag means you cannot use it for real-time arbitrage or spotting flash sales. It is best suited for macro-level market analysis, such as identifying long-term supply trends or validating neighborhood demand over time.
For investors, this distinction is critical. Free data helps you understand the landscape, but it lacks the granular, minute-by-minute precision needed for dynamic pricing strategies. If you need real-time competitor pricing or instant booking availability, you will eventually need to invest in a paid tool that scrapes data more frequently or integrates directly with Airbnb’s API.
No comments yet. Be the first to share your thoughts!