
Define your target market metrics
Before selecting a tool, you must establish the specific data points required for accurate ROI modeling. Relying on raw listing counts or vague "market health" scores introduces significant variance into your financial projections. Instead, focus on three core metrics that directly influence revenue: Average Daily Rate (ADR), Occupancy Rate, and Revenue Per Available Room (RevPAR).
ADR represents the average rental income per paid booking. It is the baseline of your pricing strategy. Occupancy Rate measures the percentage of available nights booked over a specific period. While high occupancy sounds ideal, it can mask low pricing power. This is where RevPAR becomes essential.
RevPAR normalizes performance across markets of different sizes. It combines both price and volume into a single efficiency metric. A property with a high ADR but low occupancy may underperform a property with a moderate ADR and high occupancy. Understanding this relationship prevents you from overestimating revenue in volatile markets.
To build a reliable model, pull historical data from official sources like AirDNA or BNBCalc. These platforms aggregate millions of listings to provide statistically significant averages. Avoid using single-listing comparisons, which often reflect unique circumstances rather than market trends. Use these standardized metrics to project realistic cash flows before committing capital.
Select a reliable data source
Choosing the right data source determines the accuracy of your short-term rental ROI projections. Free tools offer surface-level metrics suitable for initial screening, while paid platforms provide the granular occupancy and revenue data required for serious underwriting. API-based solutions serve developers and portfolio managers who need to automate data ingestion.
The following comparison highlights the primary differences between leading platforms regarding cost, data depth, and export capabilities.
| Platform | Cost Structure | Data Depth | Export Capability |
|---|---|---|---|
| AirDNA | Freemium ($99–$399/mo) | High (10M+ listings, 3-yr history) | CSV, API (Pro+) |
| BNBCalc | Free (Basic), Paid (Pro) | Medium (Revenue estimates, occupancy) | CSV, PDF reports |
| Airbtics | Freemium ($49–$149/mo) | High (Daily historicals, dynamic data) | CSV, API |
| AirROI | Subscription-based | Medium (Global map, market trends) | API, CSV |
AirDNA remains the industry standard for comprehensive market intelligence, tracking over 10 million listings across 120,000 markets. Its paid tiers unlock historical data and API access, which are essential for calculating long-term yield stability. BNBCalc offers a robust free tier for single-property analysis, making it a practical starting point for investors validating a specific asset. For those building custom dashboards, Airbtics and AirROI provide API access to integrate real-time occupancy and pricing data directly into financial models.
Run the ROI calculation sequence
To determine if a property meets your short-term rental ROI targets, you must translate raw market data into a structured financial model. This process moves from gathering external benchmarks to calculating net operating income (NOI) and finalizing cash-on-cash returns. We will use BNBCalc as the primary engine for this calculation, given its integration of real-time market metrics and standardized expense assumptions.
The goal is not just to find a high-revenue property, but to isolate the actual profit remaining after all operational costs. By following this five-step sequence, you ensure that your projections are grounded in verified data rather than optimistic guesswork.

Begin by entering the physical and financial specifics of the target property into BNBCalc. Input the purchase price, closing costs, and initial renovation budget to establish your total cash investment. Then, select the property type (e.g., single-family, condo) and the number of bedrooms and bathrooms. These variables dictate the baseline revenue potential and help the platform align your property with comparable listings in the local market.
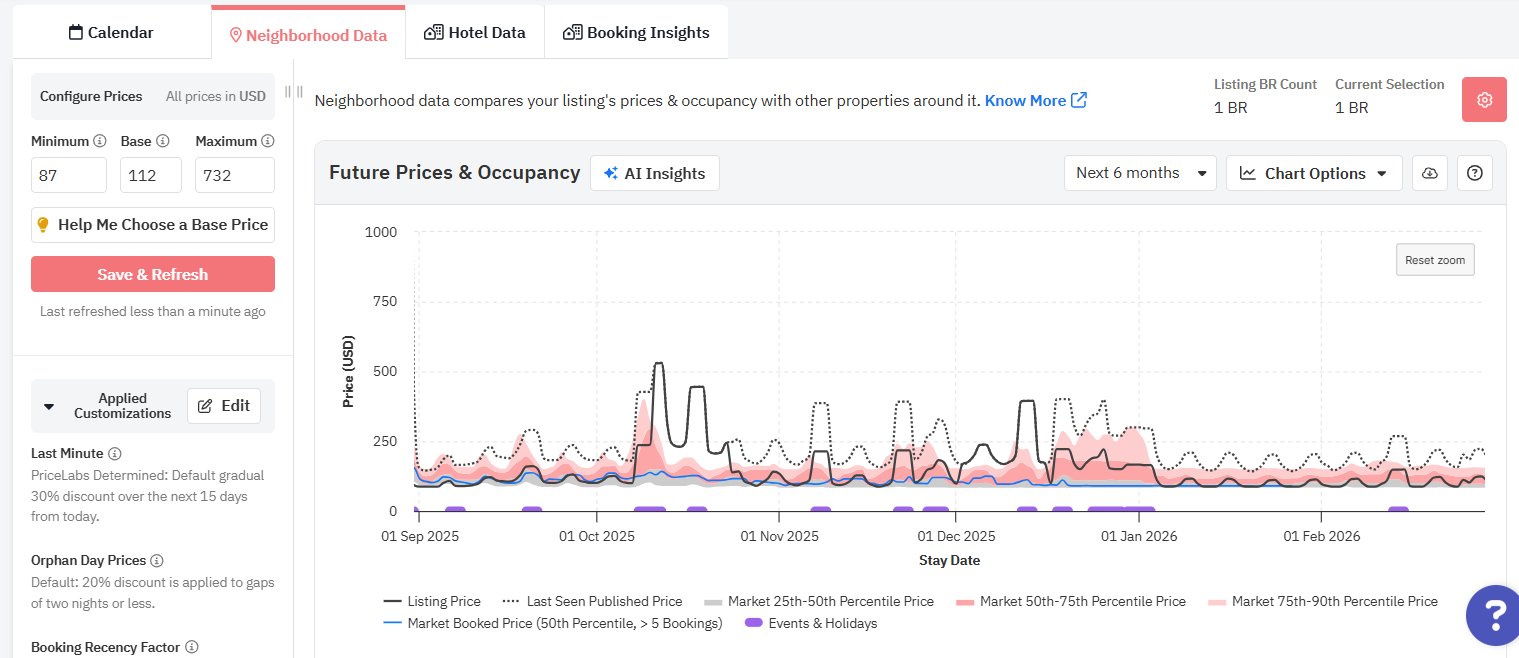
Instead of guessing occupancy rates, pull data from verified sources like AirDNA or the built-in BNBCalc market database. Enter the local Average Daily Rate (ADR) and occupancy percentage for properties with similar amenities and location quality. This step anchors your revenue projections in reality. If you have access to a specific property’s historical performance via Airbnb’s public calendar, use that data to refine these benchmarks further.
The platform automatically multiplies your daily rate by the number of occupied days per year to generate gross rental income. Review this figure against your manual estimates. If the calculated income seems low, check if your occupancy assumption is too conservative. For a more accurate picture, adjust the seasonality settings to reflect peak and off-peak demand periods in the specific neighborhood.
Net operating income is derived by subtracting all recurring costs from gross income. BNBCalc provides default percentages for expenses such as property management (typically 20-25%), cleaning fees, utilities, insurance, and maintenance. Ensure these percentages align with local vendor quotes. Do not overlook variable costs like platform service fees (Airbnb’s 3% host fee) and local transient occupancy taxes, which can significantly impact your bottom line.
Finally, input your mortgage details, including interest rate and loan term. The calculator will subtract debt service from your net operating income to determine annual cash flow. Divide this cash flow by your total initial cash investment (down payment + closing costs + renovations) to get your cash-on-cash return. This percentage is your primary metric for comparing this STR investment against other asset classes or alternative investment opportunities.
By following this sequence, you transform abstract market data into a concrete financial forecast. This methodical approach reduces the risk of overestimating returns and ensures that your short-term rental strategy is built on measurable, defensible numbers.
Validate assumptions with local regulations
Market data from AirDNA or BNBCalc reflects the theoretical maximum capacity of a property, not its legal reality. A high occupancy projection is useless if local ordinances cap your allowable rental days or prohibit short-term stays entirely. Regulatory caps on occupancy and licensing fees can instantly invalidate ROI models, turning a projected 20% return into a net loss.
Before finalizing an offer, you must verify the specific zoning laws and STR ordinances for the address. Many municipalities impose strict limits on the number of nights a property can be rented per year, or require expensive permits that erode margins. Ignoring these constraints means your financial model is based on fiction.
Use this sequence to stress-test your regulatory assumptions:
Confirm the property is in a zone that permits short-term rentals. Residential zones often restrict STRs to primary residences only, banning whole-home rentals entirely.
Look for limits on total rental days per year (e.g., 90 days) or maximum occupancy per bedroom. These caps directly reduce the "available nights" variable in your BNBCalc model.
Add permit fees, hotel tax registration costs, and potential safety inspection requirements to your annual operating expenses. These fixed costs reduce net operating income regardless of occupancy.
If the local regulations reduce your allowable rental days below the market average, you must adjust your revenue projections downward. This often means the property fails the basic ROI threshold. Always prioritize official city or county planning department data over general market trends when assessing regulatory risk.
Finalize your investment checklist
Before transferring funds, verify that every metric aligns with your underwriting model. This checklist ensures you are not relying on optimistic projections but on verified market data from sources like AirDNA and BNBCalc.
-
Verify Occupancy Rates: Cross-reference AirDNA’s estimated occupancy with local permit data. Do not rely on platform-wide averages; drill down to the specific neighborhood zip code.
-
Confirm ADR Trends: Check if the Average Daily Rate is stable or seasonal. A spike in summer rates may not justify a year-round cash flow projection.
-
Calculate Net Operating Income: Subtract all expenses (cleaning, maintenance, property management, taxes) from gross revenue. Use BNBCalc for a standardized expense ratio.
-
Stress-Test the Cap Rate: Run the numbers at 75% occupancy and 10% lower ADR. If the property still meets your minimum return threshold, the investment is viable.
-
Review Local Regulations: Confirm short-term rental ordinances in the target city. Zoning changes can instantly invalidate your ROI model.
If any item on this list reveals a gap in your data, pause the transaction. Missing information is a risk, not a detail.
Common questions about rental analytics
Understanding the mechanics of data accuracy is essential for reliable ROI projections. This section addresses technical queries regarding data sources and calculation methodologies to ensure your financial models reflect reality.
No comments yet. Be the first to share your thoughts!