
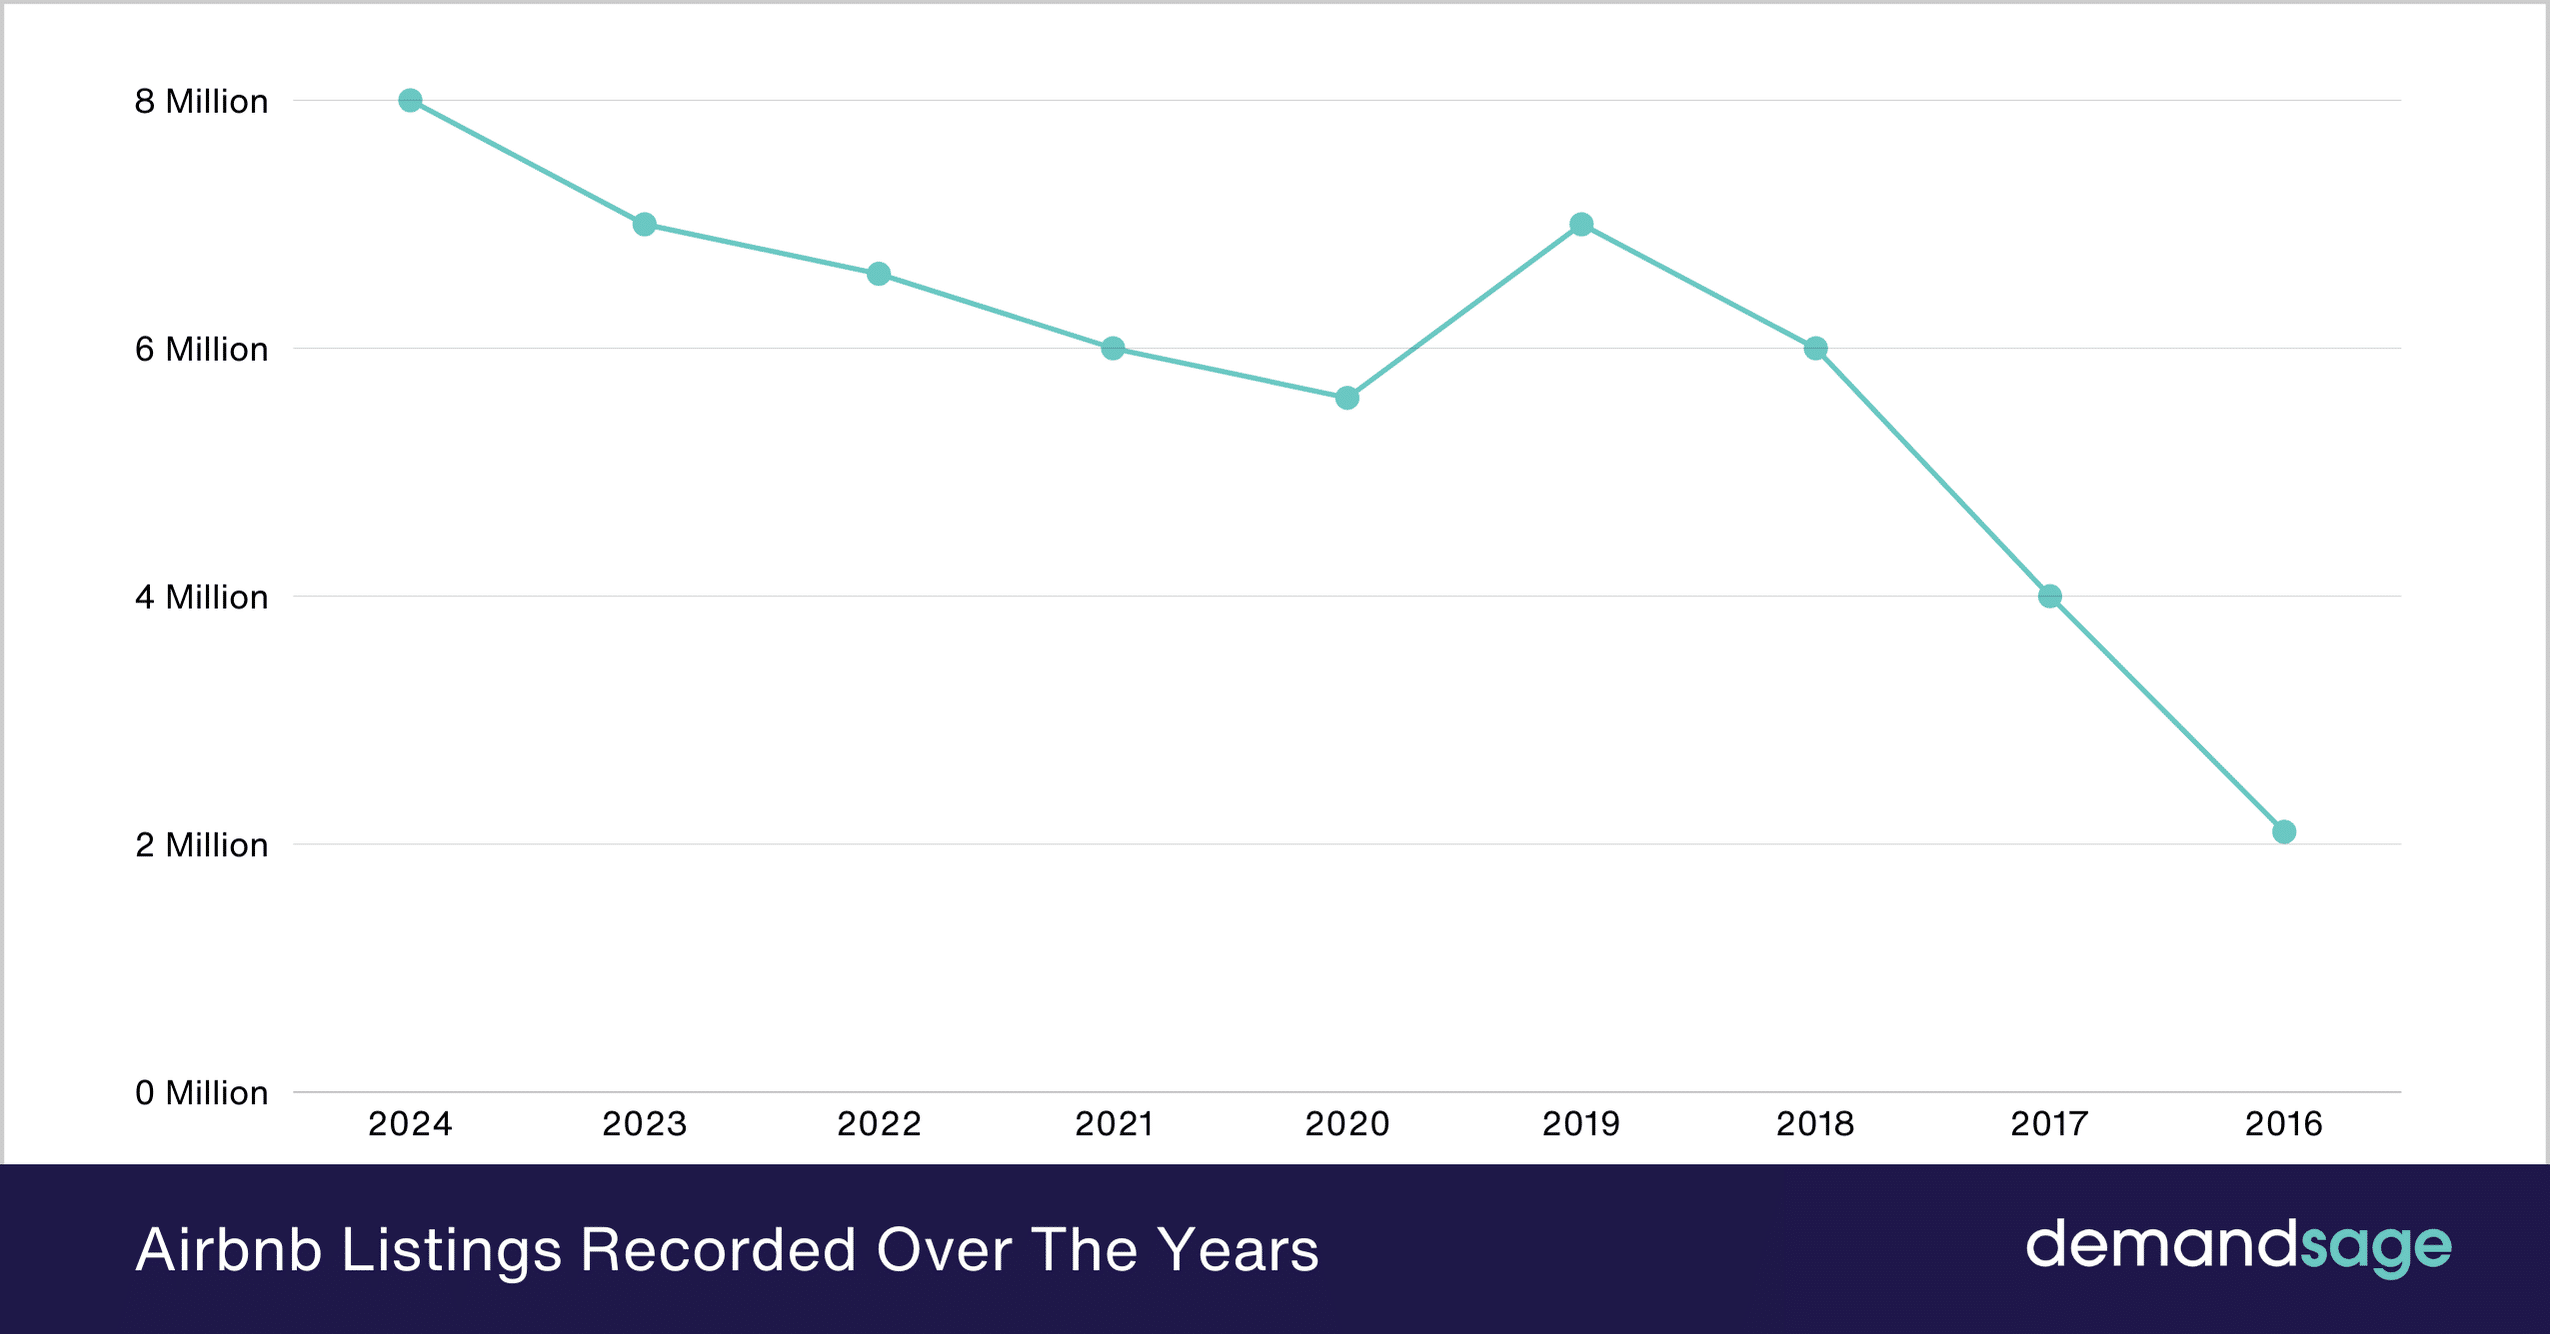
Q2 2026: A New Peak for Airbnb?
Airbnb occupancy rates hit record highs in Q2 2026, showing a full recovery from pandemic disruptions. The short-term rental market is now performing better than pre-2020 levels, indicating a structural shift in travel and accommodation preferences.
National occupancy averaged 78.3% in Q2 2026, up 12.7% year-over-year per AirDNA. This growth is significant given strong 2025 performance. Analyzing these numbers reveals the recovery wasn't uniform, which is critical for hosts and investors.
Pandemic occupancy plummeted in Q2 2020. The gradual recovery was initially driven by domestic travel and secluded stays. Now, pent-up demand, increased international travel, and a continued appetite for alternative lodging have pushed occupancy to record highs. This marks a turning point, confirming the short-term rental market has fundamentally changed.
National Occupancy: Hotspots and Laggards
Regional variations exist in Airbnb occupancy. Some markets lead the recovery, while others lag. Florida remains dominant, with the Florida Keys at 89.2% occupancy in Q2 2026, benefiting from strong domestic and returning international demand.
New Orleans shows a slower recovery at 68.5% occupancy, about 8% below 2019 levels. This is largely due to reliance on large events, which were impacted by pandemic restrictions and haven't fully normalized. San Francisco (71.1%) and Honolulu (73.8%) also show slower recoveries.
Multifaceted forces drive these disparities. Remote work fuels demand in smaller cities and outdoor destinations, while major cities reliant on business and international tourism lag. Local regulations also play a role. Cities with strict short-term rental rules, like New York City, often have lower occupancy than more permissive markets. Airbtics data shows a direct correlation between regulatory stringency and occupancy.
Some overlooked markets are growing rapidly. Boise, Idaho, saw a 19% occupancy increase year-over-year, driven by remote workers and outdoor enthusiasts. This shows the value of identifying emerging trends and adapting investment strategies.
Top & Bottom US Metro Areas - Airbnb Occupancy Performance Q2 2026
| Metro Area | Q2 2026 Occupancy Rate | Year-over-Year Change | Average Daily Rate (ADR) |
|---|---|---|---|
| Miami, FL | 88.3% | 12.5% | $285 |
| Orlando, FL | 85.7% | 9.8% | $210 |
| Nashville, TN | 83.1% | 7.2% | $240 |
| Honolulu, HI | 81.9% | 6.1% | $310 |
| New Orleans, LA | 80.5% | 10.3% | $195 |
| Las Vegas, NV | 79.2% | 8.9% | $175 |
| Austin, TX | 78.6% | 5.4% | $260 |
| Savannah, GA | 77.9% | 11.7% | $200 |
| Charleston, SC | 76.5% | 6.8% | $230 |
| Phoenix, AZ | 75.1% | 4.2% | $180 |
| St. Louis, MO | 58.2% | -3.1% | $110 |
| Cleveland, OH | 55.9% | -1.5% | $95 |
| Detroit, MI | 53.7% | -2.8% | $88 |
| Memphis, TN | 51.4% | -4.5% | $75 |
| Birmingham, AL | 49.8% | -5.2% | $70 |
Illustrative comparison based on the article research brief. Verify current pricing, limits, and product details in the official docs before relying on it.
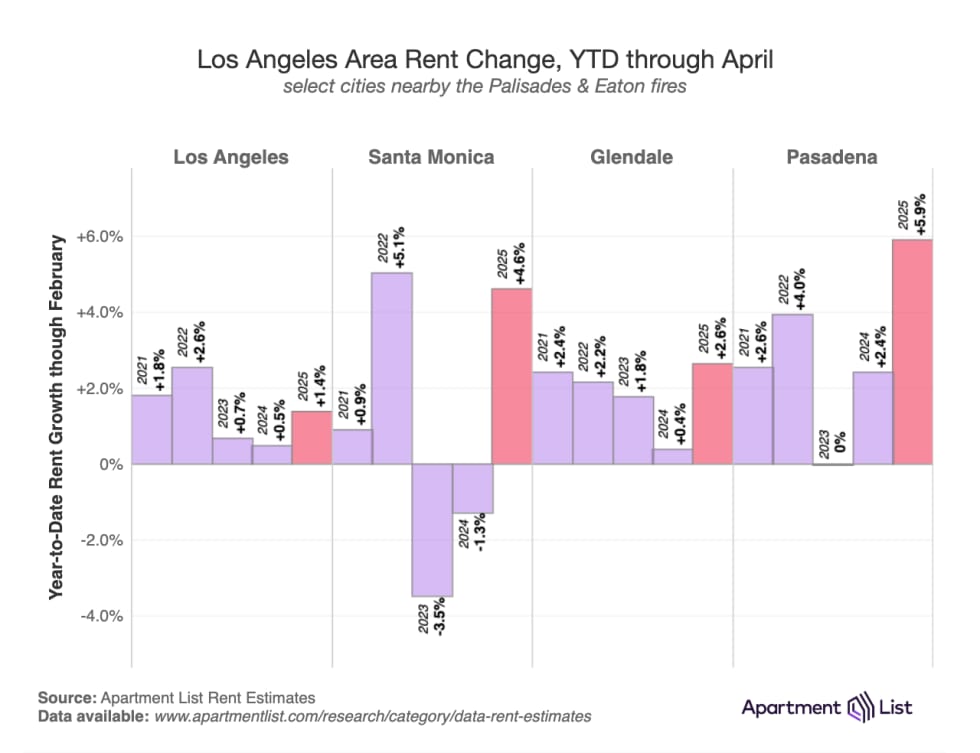
It’s true many @airbnb_au owners will just raise their rates to cover most or all of this new 7.5% tax, but that doesn’t make this law a bad thing.
— MFWitches (@MFWitches) September 20, 2023
First, because the tax will still go to build more social housing, and second because Airbnb occupancy rates should fall (because… pic.twitter.com/We9eHZ0Zf6
Property Type Performance: Houses vs. Apartments
Houses consistently outperformed apartments in the Airbnb market during the pandemic recovery. This trend continued into Q2 2026, though the gap is narrowing. Houses averaged 81.5% occupancy, compared to 75.2% for apartments. The preference for spaciousness and privacy remains a factor.
Smaller units like studios and one-bedroom apartments are resurging. They are becoming more attractive to solo travelers and couples seeking affordable urban options. Rabbu's data shows a 10% increase in studio bookings in Q2 2026, suggesting a demand shift.
Average Daily Rate (ADR) also varies by property type. Houses averaged $285 per night in Q2 2026, compared to $175 for apartments. Revenue Per Available Rental (RevPAR) shows houses at $232 and apartments at $131. Understanding each property type's dynamics is important for investment decisions.
Travel group size influences these trends. Larger families and groups favor houses, while smaller groups or individuals opt for apartments' convenience and affordability. Hosts offering a diverse property portfolio are best positioned for success.
Pricing Power: ADR and Revenue Growth
Increased demand has given hosts more pricing power. Average Daily Rates (ADR) rose 8.2% in Q2 2026 to $215 per night. This growth outpaces occupancy increases, showing hosts are translating demand into higher revenue.
The occupancy-price relationship isn't always linear. In competitive markets, ADR growth can be constrained by price elasticity. Miami and Las Vegas show signs of reaching price ceilings, where higher rates could reduce occupancy.
Dynamic pricing tools are increasingly important for maximizing revenue. They automatically adjust rates based on demand, seasonality, and competitor pricing. Hosts using these tools generally achieve higher ADRs and RevPAR than those using manual strategies.
Data shows a strong positive correlation between occupancy and ADR. Higher occupancy markets generally command higher prices. Focusing on strategies to increase occupancy, like improving listing quality and offering competitive amenities, can also boost revenue.
Q2 2026 Airbnb Market Performance: Occupancy vs. ADR
Data: AI-generated estimate for illustration
Seasonality Shifts: The Extended Travel Season
The traditional summer peak season for Airbnb travel is less pronounced. Occupancy rates remain high longer, extending the travel season into spring and fall. This shift is largely due to remote work and 'bleisure' travel.
Remote workers are using their flexibility to travel and work from different locations, increasing demand for short-term rentals outside summer. This trend is noticeable in coastal destinations and cities with attractive amenities.
The extended travel season offers hosts an opportunity for consistent year-round revenue, rather than relying solely on summer. Hosts adapting pricing and marketing to changing demand patterns will likely see the greatest financial benefits.
Occupancy rates in September and October 2026 were up 15% compared to 2019, showing a clear extension of the travel season. This requires hosts to re-evaluate operational strategies to maintain consistent quality and service year-round
Demand Drivers: Events and Macro Trends
Several factors are fueling the ongoing recovery in Airbnb occupancy. Major events, such as conferences, festivals, and sporting events, continue to drive significant demand in specific locations. For example, the Formula 1 race in Miami in May 2026 resulted in a 35% increase in occupancy rates in the surrounding areas.
However, broader macro trends are also playing a crucial role. The continued growth of remote work, the return of international travel, and changing consumer preferences are all contributing to the sustained demand for short-term rentals. The easing of travel restrictions has been particularly impactful, allowing international tourists to return to popular destinations.
Inflation and economic uncertainty are presenting a mixed bag. While rising prices may deter some travelers, others are opting for Airbnb as a more affordable alternative to hotels. The value proposition of Airbnb – offering more space, amenities, and flexibility – is resonating with budget-conscious travelers.
The increasing desire for authentic travel experiences is also a key driver. Airbnb allows travelers to immerse themselves in local communities and experience destinations from a different perspective. This trend is particularly appealing to younger generations and travelers seeking unique and memorable experiences.
Content is being updated. Check back soon.
Investment Implications: Where to Buy Now?
Based on the current data, markets with strong occupancy rates, growing demand, and favorable regulatory environments present the best investment opportunities. Florida continues to be a top pick, particularly cities like Orlando and Tampa, which are benefiting from both tourism and population growth.
Emerging markets, such as Boise, Idaho, and Asheville, North Carolina, also offer attractive potential. These cities are experiencing rapid growth and have a relatively limited supply of short-term rentals. However, it’s crucial to conduct thorough due diligence and understand local regulations before investing.
Markets that are currently overvalued – such as San Francisco and New York City – may present higher risks. While these cities have strong long-term potential, high property prices and strict regulations could limit potential returns. Careful consideration of cap rates and potential for appreciation is essential.
Investors should prioritize properties that cater to a diverse range of travelers. Offering a mix of houses and apartments, as well as properties in both urban and rural locations, can help mitigate risk and maximize revenue. Remember that local regulations are constantly evolving, so staying informed and adapting to changing conditions is paramount. Investing in short-term rentals involves inherent risks, so a conservative approach and thorough research are always recommended.
No comments yet. Be the first to share your thoughts!