
2026 market shift
Short-term rental investing has changed since the 2021 boom. While the easy gains are gone, a maturing market rewards investors who look beyond obvious tourist traps. We are seeing a shift toward locations that support both remote work and traditional vacations.
A big driver of this change is the evolving nature of work. Remote work is no longer a temporary trend; it’s a permanent fixture for many, and that’s fueling demand for longer-term rentals and unique experiences. At the same time, travelers are prioritizing value and authenticity, leading them to explore destinations beyond the usual tourist traps.
Consider Austin, Texas. Just a couple of years ago, it was the place to be. Now, new regulations limiting short-term rentals in certain areas have significantly impacted investment potential. This illustrates a crucial point: the market is dynamic, and staying ahead requires constant analysis. This isn’t about picking the same ten cities everyone else is looking at – it’s about identifying emerging opportunities based on data and forward-looking trends.
This article isn't a simple 'top 10' list. It’s a data-backed forecast of the 15 markets poised for 20%+ ROI in 2026, taking into account current trends, regulatory changes, and evolving traveler preferences. We’ll break down the numbers, explore the nuances of each location, and give you the insights you need to make informed investment decisions.
Methodology
To identify these hotspots, we’ve relied on a combination of data from leading analytics platforms like AirDNA and Mashvisor, alongside data from Rabbu. These sources provide valuable insights into occupancy rates, average daily rates (ADR), revenue per available rental (RevPAR), and overall market performance.
The key metrics we focused on were RevPAR – a strong indicator of overall earning potential – and cash-on-cash return, which provides a clear picture of profitability after expenses. We also considered occupancy rates as a measure of consistent demand and potential for year-round income. A high ADR paired with a solid occupancy rate is the sweet spot.
However, it’s important to acknowledge the limitations of any data-driven forecast. These platforms rely on publicly available data and estimations, and the short-term rental market is subject to unpredictable events – economic downturns, natural disasters, or sudden changes in regulations. No forecast is perfect.
Our weighting prioritized markets with a combination of strong current performance and projected growth. We gave more weight to RevPAR and cash-on-cash return, but also factored in regulatory stability and long-term demand drivers. We also considered the potential for diversification – favoring markets that cater to a variety of traveler types (leisure, business, family).
- RevPAR: Revenue per available rental measures total earning potential by combining occupancy and rate.
- Cash-on-Cash Return: Profitability after expenses, expressed as a percentage.
- Occupancy Rate: Percentage of nights booked, reflecting consistent demand.
- ADR: Average Daily Rate – the average price charged per night.
Key Data Sources for Short-Term Rental Investment Analysis
| Data Source | Metrics Provided | Data Quality | Potential Biases | Cost Indication |
|---|---|---|---|---|
| AirDNA | Occupancy rates, average daily rates (ADR), revenue per available rental (RevPAR), market trends, competitive analysis, listing details 🏘️ | High | Potential bias towards publicly listed rentals; may underrepresent off-market or professionally managed properties. Data accuracy relies on scraping and algorithmic processing. | Pricing built on data usage; plans available based on market coverage. |
| Mashvisor | Rental income estimates, cash flow analysis, cap rates, Airbnb rental arbitrage analysis, property finder tools 💰 | Medium | Relies on a combination of public records and Airbnb/VRBO data. Accuracy can vary depending on market and property type. May prioritize properties listed for sale on their platform. | Subscription-based; pricing tiers based on number of markets analyzed. |
| AllTheRooms Analytics | Occupancy, ADR, RevPAR, seasonality reports, competitor benchmarking, market reports | Medium | Data aggregation from multiple sources (Airbnb, VRBO, Booking.com). Potential for inconsistencies in data normalization across platforms. | Offers both free reports and paid subscriptions with more detailed data. |
| Transparent | Real-time occupancy data, pricing trends, demand forecasts, market intelligence reports 📊 | High | Focuses on professional property management companies, potentially skewing data away from individual hosts. Strong data coverage in Europe. | Enterprise-level pricing; geared towards larger property management operations. |
| Rabbu | Revenue insights, market analysis, competitive data, listing optimization tools | Medium | Data sourced from Airbnb and VRBO. Accuracy dependent on data scraping and algorithmic analysis. Focuses on optimizing existing listings. | Subscription based; tiered pricing depending on the number of listings managed. |
Illustrative comparison based on the article research brief. Verify current pricing, limits, and product details in the official docs before relying on it.
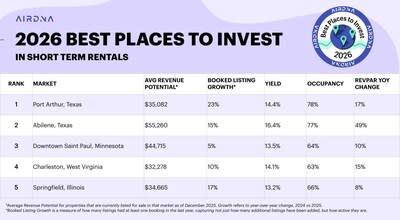
Top 15 rental markets for 2026
These 15 markets show the strongest data for 2026 based on current RevPAR growth and local regulatory stability.
1. Panama City Beach, Florida: This Florida panhandle gem continues to draw families and spring breakers. Occupancy rates consistently hover around 70%, with an ADR of $220 and a projected ROI of 25-30%. The challenge? Intense competition during peak season.
2. Gatlinburg/Pigeon Forge, Tennessee: The Smoky Mountains are a perennial favorite for tourists. Expect occupancy rates around 75%, an ADR of $200, and an ROI of 24-28%. Regulations are relatively favorable, but property taxes are increasing.
3. Myrtle Beach, South Carolina: A classic beach destination with a strong value proposition. Occupancy around 68%, ADR of $180, and ROI of 22-26%. Seasonal demand is a factor, but the lower price point attracts a wider range of travelers.
4. Savannah, Georgia: A charming historic city with a growing tourism industry. Occupancy around 72%, ADR of $230, and ROI of 23-27%. Limited inventory and increasing popularity are driving up prices.
5. Phoenix, Arizona: Despite the heat, Phoenix is a popular destination for snowbirds and outdoor enthusiasts. Occupancy around 65%, ADR of $170, and ROI of 21-25%. Water conservation regulations are becoming more stringent.
6. Orlando, Florida: Always a strong performer, driven by theme parks and events. Occupancy around 70%, ADR of $190, and ROI of 20-24%. Highly competitive market, requiring strategic property selection.
7. Gulf Shores/Orange Beach, Alabama: A quieter alternative to Florida panhandle beaches. Occupancy around 66%, ADR of $190, and ROI of 21-25%. Growing in popularity, but still relatively undiscovered.
8. Nashville, Tennessee: The 'Music City' continues to attract tourists and businesses. Occupancy around 68%, ADR of $210, and ROI of 20-24%. Regulations are tightening in certain neighborhoods.
9. San Antonio, Texas: Rich in history and culture, San Antonio offers a unique travel experience. Occupancy around 64%, ADR of $160, and ROI of 20-23%. Increasing tourism, but also a growing population.
10. Charleston, South Carolina: Another charming Southern city with a strong tourism industry. Occupancy around 70%, ADR of $240, and ROI of 21-25%. High property values and strict regulations are challenges.
11. Oklahoma City, Oklahoma: An up-and-coming market with a growing economy and affordable properties. Occupancy around 62%, ADR of $140, and ROI of 20-23%. Still relatively undiscovered, with significant growth potential.
12. Las Vegas, Nevada: Beyond the Strip, Las Vegas offers a diverse range of attractions. Occupancy around 65%, ADR of $150, and ROI of 19-22%. Competition is fierce, but demand remains strong.
13. Richmond, Virginia: A historic city with a vibrant arts and culinary scene. Occupancy around 63%, ADR of $150, and ROI of 19-22%. Growing in popularity, but still relatively affordable.
14. Albuquerque, New Mexico: A unique destination with a rich cultural heritage. Occupancy around 60%, ADR of $130, and ROI of 18-21%. Attracts a niche market of travelers interested in art and history.
15. Kansas City, Missouri: A surprisingly vibrant city with a thriving food and music scene. Occupancy around 62%, ADR of $140, and ROI of 18-21%. Affordable properties and a growing tourism industry.
Revenue Per Available Room (RevPAR) Growth Projection 2026
Bull / Base / Bear scenario analysis for top STR markets
| Timeframe | Bull Case | Base Case | Bear Case | Key Driver |
|---|---|---|---|---|
| 1 Month | $152 | $148 | $142 | Peak summer demand and festival bookings |
| 3 Months | $165 | $158 | $149 | Sustained travel recovery and corporate demand normalization |
| 6 Months | $178 | $167 | $154 | Holiday season premium pricing and inventory optimization |
| 1 Year | $195 | $175 | $162 | Market maturation and regulatory stabilization in top markets |
Price Prediction Summary
RevPAR growth expected to moderate from 2025 highs but remain strong in top-tier markets, with 8-15% annual growth driven by supply-demand rebalancing and premium property positioning. Economic headwinds could pressure growth in bear scenario.
Key Factors Affecting Revenue Per Available Room Stock Price
- Supply constraints in prime locations limiting inventory growth
- Evolving local regulations affecting market dynamics
- Consumer spending patterns and travel budget allocation
- Competition from traditional hotels and new STR entrants
Disclaimer: Predictions are speculative and not financial advice. Stock price predictions are based on current market analysis and may vary significantly due to market volatility, economic conditions, and other unpredictable factors. Always do your own research before making investment decisions.
Investment risks
Investing in short-term rentals isn’t without risk. It's crucial to be aware of the potential downsides before jumping in. Regulatory risk is a major concern. Cities are increasingly cracking down on short-term rentals, implementing stricter zoning laws, rental caps, and permitting requirements.
Economic downturns can also significantly impact demand. A recession could lead to a decrease in travel spending, resulting in lower occupancy rates and revenue. Property-specific risks, such as maintenance costs, vacancy rates, and damage from guests, should also be factored into your calculations.
Insurance is another critical consideration. Standard homeowner's insurance typically doesn't cover short-term rental activities. You'll need to purchase a specific short-term rental insurance policy, which can be more expensive. These policies typically cover liability, property damage, and loss of income.
Finally, don't underestimate the impact of seasonality. Many markets experience significant fluctuations in demand throughout the year. Be prepared for lower occupancy rates during the off-season and factor that into your financial projections. Thorough due diligence and a conservative approach to financial modeling are essential.
Essential Gear for Your Next Short-Term Rental Investment

Keyless entry with keypad or smartphone · Built-in Wi-Fi for remote access · Easy guest access management
Upgrade your rental's security and convenience with this smart lock, allowing for easy remote access and guest management.

Keyless entry via fingerprint, touchscreen, or app · No hub required, built-in Wi-Fi · Auto-lock and anti-peep PIN features for security
This affordable smart lock offers multiple keyless entry options and essential security features without the need for an extra hub.

1080p color night vision for clear footage day or night · Motion and sound detection with alerts · Indoor/outdoor use and compatibility with Alexa/Google
Keep an eye on your property and guests with this versatile and budget-friendly security camera that offers clear night vision and smart home integration.

Monitors noise, occupancy, motion, and temperature · Ensures compliance with rental regulations · Provides real-time alerts for potential issues
This all-in-one sensor helps you monitor your rental's environment and occupancy, ensuring guest comfort and regulatory compliance.

Kills 99.9% of viruses and bacteria · Multi-surface cleaning for various needs · Convenient bulk pack for stocking up
Stock up on these essential disinfecting wipes to maintain a clean and hygienic environment for every guest.
As an Amazon Associate I earn from qualifying purchases. Prices may vary.
Tools for Analyzing Potential Investments
Fortunately, there are a number of tools available to help you analyze potential investments. BNB Stats, of course, provides comprehensive Airbnb market data and rental analytics. AirDNA and Mashvisor are also valuable resources for researching market performance and identifying potential properties.
Don’t forget to utilize real estate websites like Zillow and Realtor.com to assess property values and neighborhood characteristics. Local government websites can provide information on zoning regulations and permitting requirements. A rental property roi calculator is essential to understanding potential profits.
When evaluating a property, focus on cash flow analysis. Calculate your potential rental income, subtract your expenses (mortgage, property taxes, insurance, maintenance, property management fees), and determine your net operating income. This will give you a clear picture of your potential profitability. Property management software can help streamline your operations and automate tasks like guest communication and booking management.
No comments yet. Be the first to share your thoughts!