
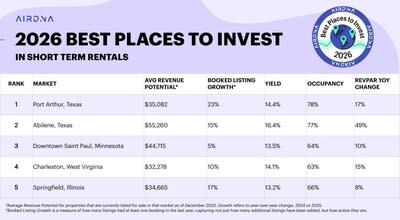
Why 2026 is a Pivotal Year for Short-Term Rental Investment
The short-term rental (STR) market experienced a surge in demand post-pandemic, but that period of rapid, almost effortless growth is over. We’re now seeing a stabilization, and in some markets, even a slight decline in occupancy rates. This isn’t necessarily a negative development; it’s a maturation of the market. The easy money has been made, and 2026 will be a year where strategic investment and data-driven decision-making are paramount.
Increased regulation is a major factor. Cities and states are grappling with the impact of STRs on housing availability and local communities, leading to stricter rules and enforcement. Simultaneously, competition is increasing as more investors enter the market. To succeed in this environment, investors need to identify markets with sustainable growth potential, favorable regulatory environments, and a clear understanding of local dynamics.
I identified these markets using 2024 and 2025 data from AirDNA and Mashvisor. AirDNA provides comprehensive data on occupancy rates, average daily rates (ADR), and revenue, while Mashvisor offers tools for analyzing potential investment properties and calculating cash flow. Both platforms are valuable resources, and this report leverages their strengths to pinpoint the top 15 markets to watch in 2026. We're looking beyond simple occupancy and focusing on long-term viability.
STR-friendly. Gulf-front. Oversized lot. 🤑
— Carter Signature Properties (@CarterSignature) April 12, 2026
If you've been looking for a Texas Gulf Coast lot that actually makes sense as a short-term rental investment — this is it. 7910 Bluewater Hwy sits on the seaward side of Bluewater Hwy in Surfside Beach with direct beach access and room… pic.twitter.com/YcbIqViGta
The Methodology: Ranking Markets for Future Performance
Determining these hotspots wasn’t arbitrary. We employed a weighted scoring system based on several key metrics, all sourced from AirDNA and Mashvisor data as of late 2024 and early 2025, with projections extending to 2026. Occupancy rates were considered, of course, but they weren't the sole determinant. We placed a heavier emphasis on year-over-year revenue growth, which provides a more accurate picture of a market's trajectory.
Average Daily Rate (ADR) and Revenue Per Available Room (RevPAR) were also important factors, but we looked beyond the averages to assess consistency and seasonality. A market with high ADR but significant seasonal fluctuations is riskier than one with stable, year-round demand. The regulatory environment – current rules and pending legislation – played a significant role, as did the potential for future growth based on population trends, job creation, and tourism development.
The weighting was roughly 30% revenue growth, 25% regulatory environment, 20% occupancy, 15% ADR/RevPAR, and 10% future growth potential. This prioritization reflects our belief that sustainable growth and a favorable legal landscape are more important than simply finding markets with high current occupancy. It's about identifying where future returns will be, not just celebrating past performance.
- Revenue Growth (30%): Year-over-year performance is key.
- Regulatory Environment (25%): Stability and investor-friendliness are prioritized.
- Occupancy (20%): A baseline indicator of demand.
- ADR/RevPAR (15%): Assessing pricing power and profitability.
- Future Growth Potential (10%): Considering population and economic trends.
Short-Term Rental Market Ranking Methodology - 2026 Outlook
| Metric | Weight (%) | Rationale |
|---|---|---|
| Occupancy Rate | 25% | Reflects current demand and the ability to generate consistent income. A higher occupancy rate indicates a robust market. |
| Average Daily Rate (ADR) | 20% | Indicates the revenue potential per booking. While occupancy drives consistency, ADR impacts overall profitability. |
| Revenue Growth (Year-over-Year) | 20% | Highlights markets experiencing increasing demand and investor interest, signaling future potential. |
| Seasonality | 10% | Assesses the stability of income throughout the year. Markets with less pronounced seasonality offer more reliable returns. |
| Regulatory Environment | 15% | Considers the friendliness of local regulations towards short-term rentals. Restrictive regulations can significantly impact investment viability. |
| Future Growth Potential | 10% | Evaluates factors like population growth, tourism development, and economic forecasts to anticipate long-term market health. |
Illustrative comparison based on the article research brief. Verify current pricing, limits, and product details in the official docs before relying on it.
Tier 1: The Established Powerhouses
These are the markets that consistently deliver strong performance and are likely to remain attractive to STR investors in 2026. Orlando, Florida, is a perennial favorite, driven by its theme parks and robust tourism industry. As of late 2024, Orlando boasted an occupancy rate of around 78% with an ADR of $185, according to AirDNA. However, increasing inventory and potential for stricter regulations are risks to monitor.
Nashville, Tennessee, continues to attract visitors with its vibrant music scene and growing economy. Mashvisor data indicates a potential cash-on-cash return of around 10% for STR properties in Nashville. Phoenix, Arizona, benefits from a warm climate and affordability, but faces challenges related to water scarcity and rising property taxes. Myrtle Beach, South Carolina, is a popular family vacation destination with consistent demand, but is susceptible to seasonal fluctuations.
Las Vegas, Nevada, remains a strong performer, but its dependence on tourism makes it vulnerable to economic downturns. Current occupancy hovers around 75%, with an ADR of $150. Competition is fierce in all of these markets, and investors need to differentiate their properties to stand out. These aren't 'easy' wins, but they offer a proven track record.
Tier 2: Rising Stars with Strong Growth Potential
These markets are experiencing rapid growth and offer significant opportunities for investors. Dallas, Texas, is benefiting from a booming economy and population influx. Job growth is a major driver, and the city offers a diverse range of attractions. Charlotte, North Carolina, is another fast-growing city with a strong financial sector and a desirable quality of life. Data from Mashvisor suggests a cash-on-cash return potential of up to 12% for well-managed properties.
Atlanta, Georgia, is a major transportation hub and a center for film and television production. Savannah, Georgia, draws tourists for its historic district and local galleries. Denver, Colorado, continues to be a popular destination for outdoor enthusiasts and young professionals. However, Denver's housing costs are rising, and the regulatory environment is becoming more complex.
The regulatory landscape in these Tier 2 cities is evolving. Atlanta, for example, is currently debating stricter short-term rental regulations. Investors need to stay informed about these changes and be prepared to adapt their strategies. Getting in early in these markets could yield substantial returns, but it requires careful due diligence and a proactive approach to compliance.
Short-Term Rental Revenue Price Prediction 2026
Bull / Base / Bear scenario analysis for Dallas, TX 2-bedroom property
| Timeframe | Bull Case | Base Case | Bear Case | Key Driver |
|---|---|---|---|---|
| 1 Month | $3,360/month | $3,250/month | $3,040/month | Spring travel season demand surge and March business conferences |
| 3 Months | $3,680/month | $3,450/month | $3,120/month | Peak summer tourism season and corporate relocation activity |
| 6 Months | $3,840/month | $3,520/month | $3,200/month | Fall corporate events offset by seasonal tourism decline |
| 1 Year | $4,160/month | $3,680/month | $3,360/month | Dallas market maturation and increased supply competition |
Price Prediction Summary
Dallas STR revenue shows moderate growth potential driven by strong business travel recovery and tourism expansion. Base case projects 15% annual growth, while supply increases may cap upside in mature markets.
Key Factors Affecting Short-Term Rental Revenue Stock Price
- Dallas tourism recovery and business travel normalization
- New STR supply entering popular neighborhoods
- Regulatory changes and zoning restrictions
- Economic conditions affecting discretionary travel spending
Disclaimer: Predictions are speculative and not financial advice. Stock price predictions are based on current market analysis and may vary significantly due to market volatility, economic conditions, and other unpredictable factors. Always do your own research before making investment decisions.
Tier 3: Undervalued Gems and Emerging Markets
These markets are often overlooked by investors, but they offer significant potential for appreciation and strong returns. Birmingham, Alabama, is experiencing a revitalization, with a growing arts and culinary scene. Kansas City, Missouri, is attracting attention for its affordability and vibrant cultural attractions. Oklahoma City, Oklahoma, is benefiting from a diversified economy and a low cost of living.
Cincinnati, Ohio, and Louisville, Kentucky, offer a combination of affordability, historical charm, and a growing tourism industry. These markets are particularly attractive to investors looking for cash flow opportunities. However, they also come with increased risk. Inventory may be limited, and the demand for STRs may not be as established as in Tier 1 and Tier 2 markets.
Due diligence is crucial in these markets. Thoroughly research local regulations, assess the potential for future growth, and carefully evaluate property values. These markets require a more hands-on approach, but the potential rewards can be substantial. A rental property ROI calculator is essential for assessing potential profitability in these less-established areas.
Navigating the Regulatory Maze: A State-by-State Snapshot
Short-term rental regulations vary significantly from state to state, and even city to city. Florida currently has a relatively permissive regulatory environment, but some cities, like Miami Beach, are implementing stricter rules. Texas generally allows STRs, but local municipalities have the authority to regulate them. It's vital to check county and city ordinances.
North Carolina has seen increasing restrictions on STRs, particularly in coastal areas. Arizona has a patchwork of regulations, with some cities allowing STRs with permits and others banning them outright. Georgia allows STRs, but requires hosts to collect and remit hotel taxes. Staying informed about these changes is critical for protecting your investment.
Resources like the Vacation Rental Management Association (VRMA) and local real estate attorneys can provide valuable guidance on navigating the regulatory landscape. Ignoring local regulations can result in hefty fines and even the loss of your rental license. Proactive compliance is not just a legal obligation, it’s a smart business practice.
Content is being updated. Check back soon.
Tools and Resources for Short-Term Rental Investors
Several tools and resources can help investors make informed decisions. AirDNA and Mashvisor remain essential for market analysis and property valuation. Property management software like Guesty and Lodgify can streamline operations and automate tasks. Legal resources, such as local real estate attorneys specializing in STRs, can provide guidance on compliance.
Online communities, like the BiggerPockets forums, offer a platform for investors to share insights and ask questions. BNB Stats provides comprehensive Airbnb market data, rental analytics, and investment insights, helping hosts and real estate investors track occupancy rates, pricing trends, and revenue optimization strategies. We aim to provide clear, actionable data to empower your investment decisions.
Remember that the STR market is constantly evolving. Continuous learning and adaptation are essential for success. Leverage these resources to stay informed, make smart investments, and maximize your returns. The key is to move beyond guesswork and embrace a data-driven approach.
- AirDNA: Comprehensive STR data analytics.
- Mashvisor: Investment property analysis and cash flow calculator.
- Guesty/Lodgify: Property management software.
- BiggerPockets: Online investor community.
- BNB Stats: Airbnb market data and investment insights.
Essential STR Investment Tools
- AirDNA - Provides detailed data on Airbnb and Vrbo performance, including occupancy rates, average daily rates (ADR), and revenue estimates. Offers market-level and property-level analytics. AirDNA
- AllTheRooms Analytics - Aggregates data from multiple short-term rental platforms (Airbnb, Vrbo, Booking.com) to provide a comprehensive view of market trends and competitor performance. AllTheRooms Analytics
- Mashvisor - Focuses on real estate investment analysis, including short-term rental potential. Features a rental income calculator and property marketplace. Mashvisor
- Rentometer - Helps determine fair market rent by comparing properties in a specific area. Useful for setting competitive pricing for short-term rentals. Rentometer
- Transparent - Offers insights into vacation rental demand and performance, with a focus on providing data for professional property managers and investors. Transparent
- BNB Stats - Delivers comprehensive Airbnb market data, rental analytics, and investment insights. Track occupancy rates, pricing trends, and revenue optimization strategies. BNB Stats
- Airdesk - A platform designed for co-hosting and property management, offering features like automated messaging, guest screening, and calendar synchronization. Airdesk
No comments yet. Be the first to share your thoughts!